1

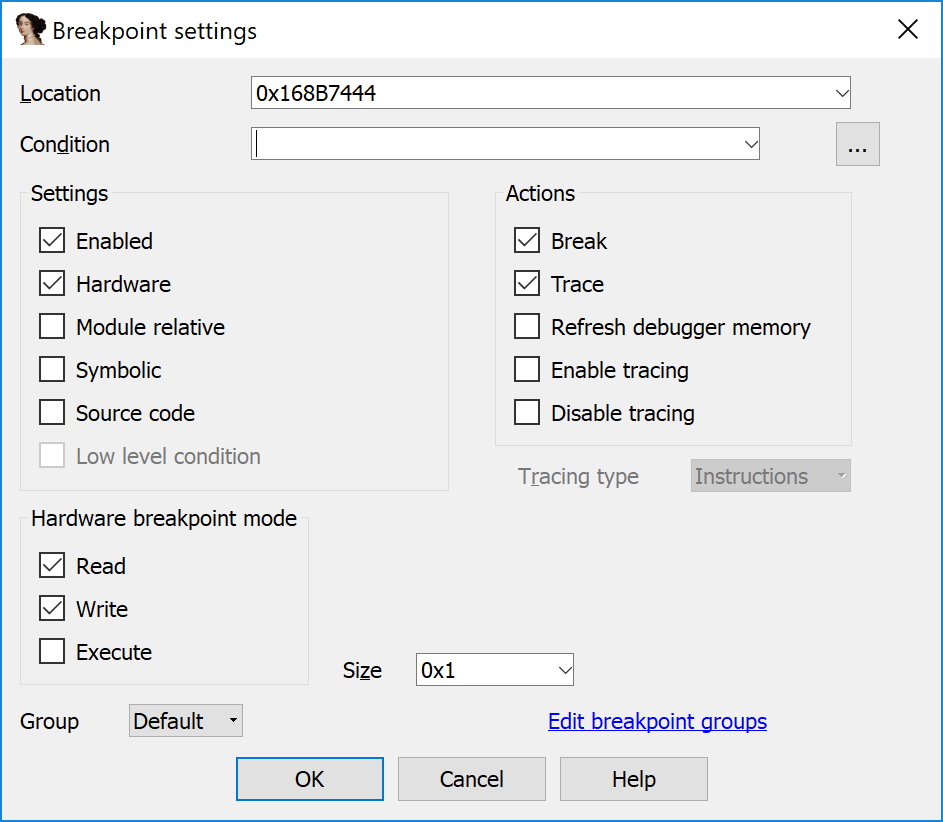
When I set a hardware breakpoint I see the following dialog:

enter image description here

I understand that Read/Write is meant to break into the debugger when the address that I choose for the breakpoint is read or written.

I guess that the Break (in the Actions tab) means to break whenever the read/write happens.

But I don't understand what is the other options in the Actions tab mean (Trace, Refresh debugger memory, ...).

Could you please explain these additional options?!
1 Answer 1

3

The options are explained in the help but I guess it could be a little laconic.

The actions in Actions group are performed whenever the breakpoint is triggered (also expressed as hit or fired), and the condition (if specified) is satisfied. The actions explained:

  • Break: Suspend the debugged application (default action). You might want to turn it off if you peform some work in the condition script and do not actually need to suspend the app (but a better approach would be to return 0 from the condition expression), or if you only need one of the other actions.
  • Trace: Adds a new entry to the trace log
  • Refresh debugger memory:

    By default IDA does not refresh the memory config before evaluating a breakpoint condition. This option enables the refresh. To refresh it [manually] call refresh_debugger_memory()

  • Enable tracing:
    Enable tracing when the breakpoint hits. This is different from the trace action (where only a new entry is added to the trace log).

  • Disable tracing:
    Disable tracing when the breakpoint fires.

  • Tracing type:
    Instruction, Function and Basic block level tracing types can be selected for breakpoints if enable or disable tracing action has been selected.

Your Answer

By clicking “Post Your Answer”, you agree to our terms of service and acknowledge you have read our privacy policy.

Not the answer you're looking for? Browse other questions tagged or ask your own question.