3

Below questions are related to IDA Pro debugging:

1) How can I see values of general registers directly in Registers view of IDA Pro similar to Olly instead of clicking on jump link? It is having jump link which takes to declaration of value (See the right top corner of the attached image for comparison between IDA Pro and Olly)

2) How can I see values of stack in ASCII format in Stack view like Ollydb. I see some debug007:1000dfXXXX kind values, but not ASCII decoded values.

3) Further I would like to see arguments being passed to APIs or Functions. For example ReadFile api takes arguments of hFile, Ollydb shows it in stack view but IDA pro's stack view is not clear (See bottom right corner of the attached image to compare between IDA pro and ollydb)

4) When I try to use ASCII as decoding format for Text of HEX view it is not showing right output it is completely different from Olly.
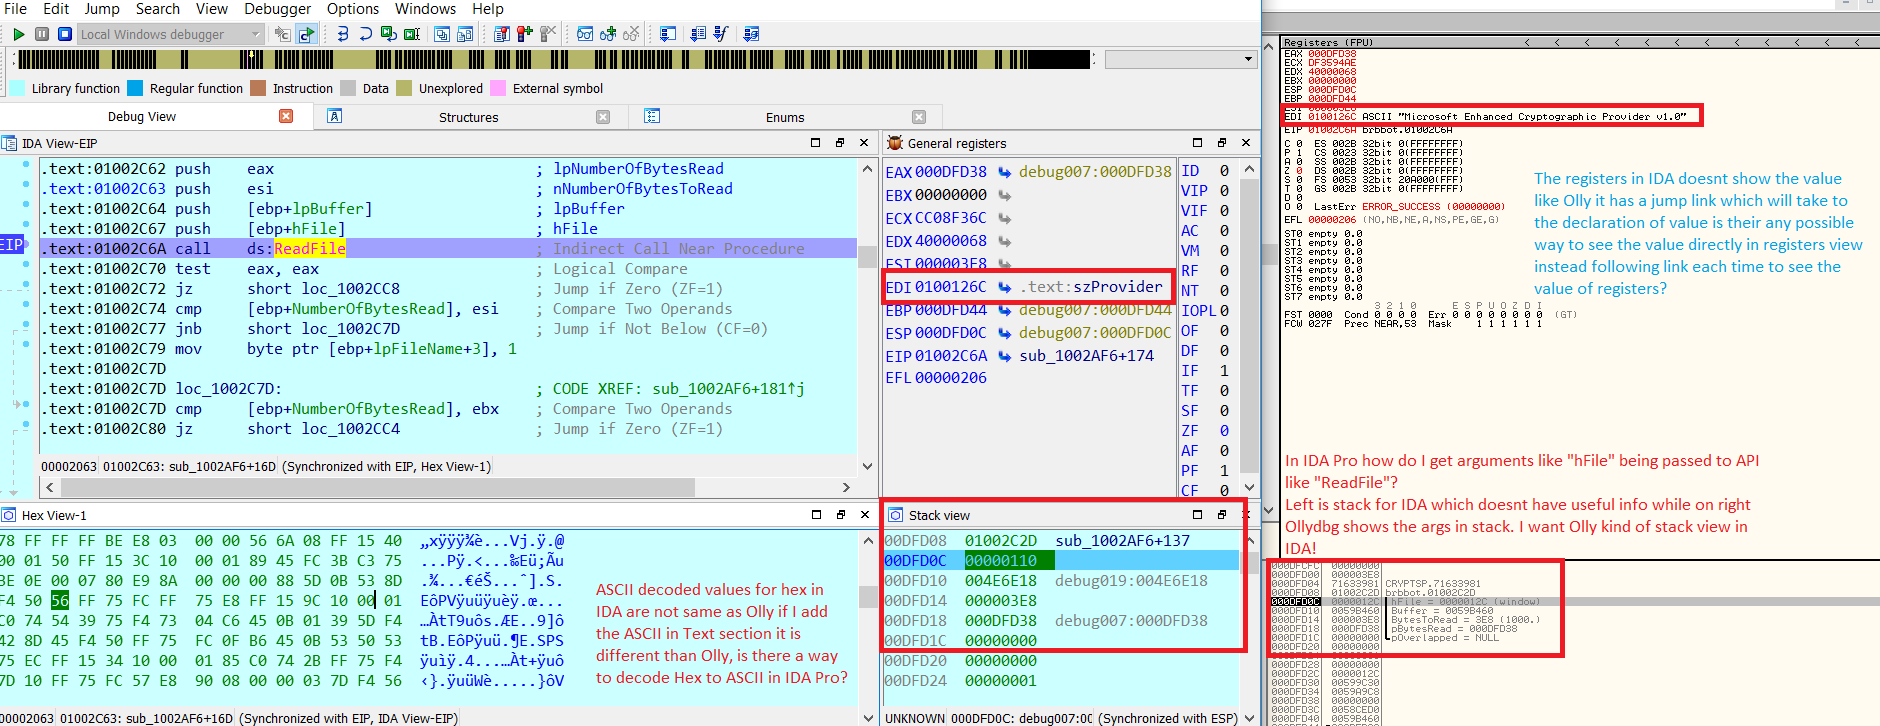
screenshot of IDA Pro and Olly comparison

1 Answer 1

1

Ida and ollydbg are very different, ollydbg is just a debugger, ida is a powerful disassembler to reverse with a debugger.

In your capture, ollydbg places the names of the arguments in the stack. Ida is more generic and shows the arguments in the call. Ollydbg is only a 32-bit debugger and the arguments are passed on the stack, but ida is a 32 and 64 bit disassembler and in 64 bits the arguments are no longer passed through the stack, for this reason it is more effective to show the names of the arguments in the call, which works in 32 and 64 bits.

1
  • ok how to view the arguments of the call in ASCII format in ida though?
    – Alya Gomaa
    Commented Jan 9, 2020 at 22:45

Your Answer

By clicking “Post Your Answer”, you agree to our terms of service and acknowledge you have read our privacy policy.

Not the answer you're looking for? Browse other questions tagged or ask your own question.