2

I'm using IDA Pro and WinDbg as a debugger. So I loaded an executable process into it. And now I need to know the entry point (or base address) of that loaded executable, the same as I would get from calling these APIs:

MODULEINFO mi = {0};
if(::GetModuleInformation(::GetCurrentProcess(), ::GetModuleHandle(NULL), &mi, sizeof(mi)))
{
    //Needed entry point is:
    pEntryPoint = mi.EntryPoint;
}

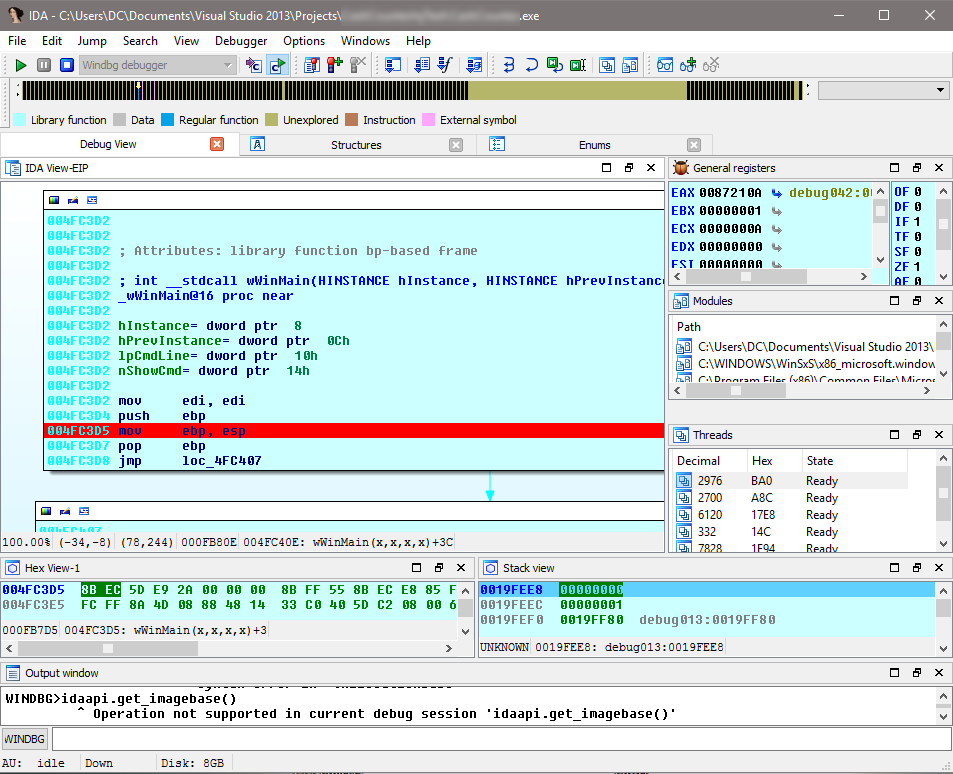
I found this reference, but when I do:

idaapi.get_imagebase()

it gives me the error:

Operation not supported in current debug session 'idaapi.get_imagebase()'

enter image description here

Sorry, I'm new to IDA. What am I doing wrong?
1 Answer 1

4

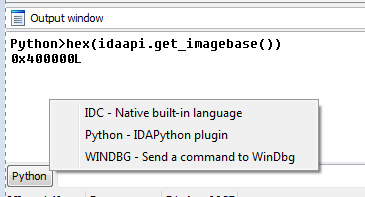
You need to switch to a different command line. Currently, you're using the WinDbg command line, which allows you to send commands to WinDbg instead of IDAPython:

enter image description here

Click on WinDbg, or press Ctrl to switch to IDAPython, where idaapi.get_imagebase() works fine:

enter image description here

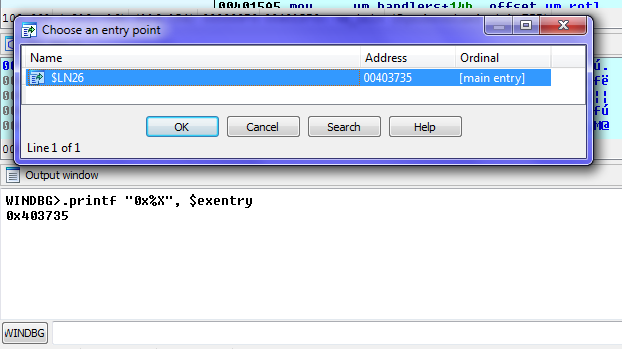
However, this doesn't really answer your question. What you want is the entry point, and to find it, you can either press CtrlE in IDA, or find it with WinDbg:

enter image description here

The command is:

.printf "0x%X", $exentry
2
  • Appreciate it. Will doing u $exentry for WinDbg console work as well?
    – c00000fd
    Commented Nov 27, 2016 at 10:49
  • @c00000fd Yeah. The input you see in IDA sends the text to the WinDbg's debugger backend, so it goes to the same command processor. You're just using it from different interfaces.
    – Martin
    Commented Nov 27, 2016 at 18:00

Your Answer

By clicking “Post Your Answer”, you agree to our terms of service and acknowledge you have read our privacy policy.

Not the answer you're looking for? Browse other questions tagged or ask your own question.