explorer uses Find...File.... functions from kernelbase.dll
you can set breakpoints on them
how are you debugging explorer.exe
when a new instance is spawned iirc ShellExecute is used to open a newwindow
and the debugger will terminate if there is an already running instance of explorer.exe.
you need to use the console based cdb.exe instead of gui windbg to debug the gui explorer.exe
also if debugging on single machine you should avoid doing operation that will deadlock possibly minimizing , open file , spawning other gui apps etc may result in deadlock
here is a FindFirstFileExW break on explorer.exe attached in a cdb.exe session on a running explorer.exe using cdb -p pid command
0:004> bp KERNELBASE!FindFirstFileExW
0:004> bp KERNELBASE!FindNextFileW
0:004> g
Breakpoint 0 hit
KERNELBASE!FindFirstFileExW:
00007ffa`901cfae0 4055            push    rbp
0:003> k
Child-SP          RetAddr           Call Site
00000000`0342e688 00007ffa`901cfacc KERNELBASE!FindFirstFileExW
00000000`0342e690 00007ffa`918de5df KERNELBASE!FindFirstFileW+0x1c
00000000`0342e6d0 00007ffa`918de44b SHELL32!IsNonCloudFilePlaceholderReparsePoint+0x2b
00000000`0342e960 00007ffa`91921b08 SHELL32!PathGetVolumeRoot+0xb7
00000000`0342ebc0 00007ffa`9192187f SHELL32!GetRecreatableRecycleBinLocation+0x58
00000000`0342ef00 00007ffa`91c139e8 SHELL32!CRecycleBinManager::_DiscoverRecycleBin+0xff
00000000`0342f190 00007ffa`91ad1bbc SHELL32!CRecycleBinManager::WillRecycle+0x38
00000000`0342f1c0 00007ffa`919f2593 SHELL32!CRibbonDeleteCommand::_CanRecycle+0x114
00000000`0342f260 00007ffa`8dc42e0b SHELL32!CRibbonDeleteCommand::GetState+0x15db83
00000000`0342f2d0 00007ffa`91898cc9 windows_storage!RegDataDrivenCommand::GetState+0x26b
00000000`0342f320 00007ffa`9191e031 SHELL32!CVerbStateTask::InternalResumeRT+0x109
00000000`0342f390 00007ffa`8dc6b75c SHELL32!CRunnableTask::Run+0xc1
00000000`0342f3e0 00007ffa`8dc6b3a1 windows_storage!CShellTask::TT_Run+0x3c
00000000`0342f410 00007ffa`8dce5af4 windows_storage!CShellTaskThread::ThreadProc+0xdd
00000000`0342f4c0 00007ffa`90e43106 windows_storage!CShellTaskThread::s_ThreadProc+0x44
00000000`0342f520 00007ffa`927ffd23 shcore!ExecuteWorkItemThreadProc+0x16
00000000`0342f550 00007ffa`927e31fa ntdll!RtlpTpWorkCallback+0x173
00000000`0342f630 00007ffa`91627614 ntdll!TppWorkerThread+0x68a
00000000`0342f930 00007ffa`927e26f1 KERNEL32!BaseThreadInitThunk+0x14
00000000`0342f960 00000000`00000000 ntdll!RtlUserThreadStart+0x21

0:003> |
.  0    id: 294 attach  name: C:\WINDOWS\Explorer.EXE

0:003> ~.
.  3  Id: 294.76c Suspend: 1 Teb: 00000000`011df000 Unfrozen
      Start: ntdll!TppWorkerThread (00007ffa`927e2b70)
      Priority: 0  Priority class: 32  Affinity: f
EDIT
i answered generically and i don't know what your code does or why you cannot see what you wish to see as you have not provided any code or error details
there are lot of hook library and instrumentation frameworks to verify if some function is being called by some module / binary
one such versatile instrumentation framework is frida
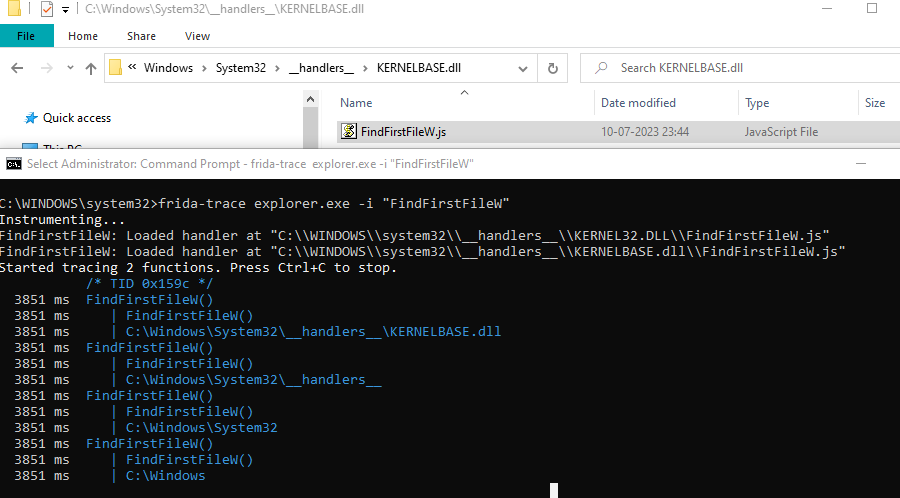
using frida-trace you can see FindFirstFileW is being called and log also log the argument being passed as shown in the screen shot below
after starting trace i double clicked the js file and it opened up the open with dialog
and frida has logged the file name along with path
using this code in the interceptor
onEnter(log, args, state) {
    log('FindFirstFileW()');
    log(args[0].readUtf16String());
  },

