I am trying to grasp an anti-debugging trick used in this program. Upon attaching any debugger (x64dbg, VEH debugger) the software crashes after about 2 seconds.
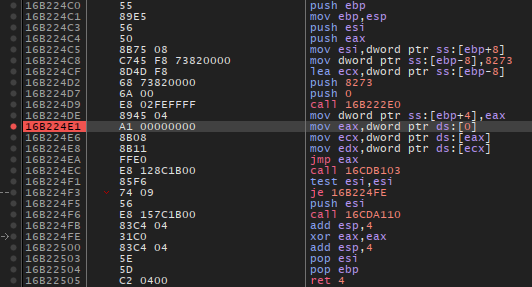
x64dbg shows me that the following instruction causes an exception:
After stepping over it, control immediately transfers to ntdll._KiUserExceptionDispatcher, calling some vectored exception handler, which eventually ends up executing int 0x29 (KiRaiseSecurityFailure), crashing the program.
The log shows the following information regarding the exception
EXCEPTION_DEBUG_INFO:
           dwFirstChance: 1
           ExceptionCode: C0000005 (EXCEPTION_ACCESS_VIOLATION)
          ExceptionFlags: 00000000
        ExceptionAddress: 16B224E1
        NumberParameters: 2
ExceptionInformation[00]: 00000000 Read
ExceptionInformation[01]: 00000000 Inaccessible Address
This subroutine is referenced exactly once where it is getting pushed:
16B22405 | 50                             | push eax                                                                       |
16B22406 | 6A 00                          | push 0                                                                         |
16B22408 | 56                             | push esi                                                                       |
16B22409 | 68 C024B216                    | push <sub_16B224C0>       // HERE                                              |
16B2240E | 6A 00                          | push 0                                                                         |
16B22410 | 6A 00                          | push 0                                                                         |
16B22412 | E8 4CF92800                    | call <sub_16DB1D63>                                                            |
Looking into sub_16DB1D63 it is used here (ebp+10h):
16DB1D84 | 56                             | push esi                                                                       |
16DB1D85 | FF75 14                        | push dword ptr ss:[ebp+14]                                                     | [ebp+14]:sub_16DB1E7B
16DB1D88 | FF75 10                        | push dword ptr ss:[ebp+10]                                                     | [ebp+10]:sub_16DB1E7B
16DB1D8B | E8 64000000                    | call <sub_16DB1DF4>                                                            |
Now it gets weird... This subroutine apparently calls GetModuleHandleExW:
16DB1E19 | 8B4D 08                        | mov ecx,dword ptr ss:[ebp+8]                                                   |
16DB1E1C | 8B45 0C                        | mov eax,dword ptr ss:[ebp+C]                                                   |
16DB1E1F | 890E                           | mov dword ptr ds:[esi],ecx                                                     |
16DB1E21 | 8946 04                        | mov dword ptr ds:[esi+4],eax                                                   |
16DB1E24 | 8D46 0C                        | lea eax,dword ptr ds:[esi+C]                                                   |
16DB1E27 | 50                             | push eax                                                                       |
16DB1E28 | 51                             | push ecx                                                                       |
16DB1E29 | 6A 04                          | push 4                                                                         |
16DB1E2B | FF15 803DE316                  | call dword ptr ds:[<sub_16E33D80>]    // GetModuleHandleExW stub               |
So it is passing a function address as the module name? Any ideas what kind of black magic this might be?
Also in general, what are some ways to trace back such exceptions to their origins? Since vectored exception handlers are registered globally (process-wide), I can't really figure out which instruction exactly caused it (looking at the call stack, there are no suspicious instructions/threads).
Some more info: I tried several user-mode anti-anti-debugging plugins such as ScyllaHide & TitanHide. Same result. Passing all exceptions to the debuggee does not help either, although I am pretty sure this is an exception-based anti-debug mechanism.
Edit: Stupid me should have looked at the docs. Apparently, if you pass ˋGET_MODULE_HANDLE_EX_FLAG_FROM_ADDRESS (0x00000004)ˋ, then passing in any address as the module name parameter will also get the module handle. I still have no idea why this is done, though.
