3

In my BA thesis, I wanted to present a program for Windows, using various anti-debugging techniques.

One of them, which I came up on my own (possibly it is well known, but I didn't find it anywhere) involves changing control flow by using signal handlers. As far as I know, when program receives certain signal and has a function registered to handle it, the main thread is paused and the execution is passed to the handler. After it returns from the function, the main thread can either continue execution, or even terminate in case where SIGFPE or SIGSEGV was passed, for example (see this question).

However, in such a case, it is possible to cause the thread executing handler not to stop after it leaves handler scope. The anti-debugging technique I've mentioned before takes advantage of this fact and is presented below.

First of all, I'm aware that the code I'm about to present uses concepts that should never appear in a real program, should be avoided in almost every situation and never tried at home :). After establishing this, consider the following program: (I'm using GCC targeting minGW to compile it)

#include <csignal>
#include <windows.h>
#include <cstdio>

void handler(int)
{
    asm("jmp continue"); // do not return from this function; just jump to another place in the code
}

int main()
{
    signal(SIGFPE, handler); // I know that sigaction should be used instead, but it's simpler and, as far as I know it wouldn't work for Windows
    // and I know, that after receiving second signal, there will be undefined behaviour, but let's assume it won't happen
    int a = 1 / 0; // cause SIGFPE to happen
    asm("continue:");
    printf("continue execution\n");
    Sleep(5000); // to show a printed message for a while, so that the console is not being closed immediately
    ExitProcess(0);
}

So here comes my question: how could be such a program debugged, such that it's possible to see printf("continue execution\n"); line being executed?

When I tried to do this using Code::Blocks debugger (GDB), only the information that a program received SIGFPE appeared and the program crushed without printing "continue execution" string.

On the other hand, when I tried to debug it in OllyDbg, execution just stopped, nothing was printed on the screen, and I wasn't able to continue execution to the point where this string should be printed.

Upon "normal" execution it prints the string end finishes as expected.

Edit: I've also tried to pass the exception to the application (using SHIFT+F7), but I only get message saying "Debugged program was unable to process exception" and I'm unable to continue the execution.

Edit2: I will not upload the binary, since when I tried to download it, my antivirus software started to complain about it, so it would probably be marked as suspicious if someone else downloaded it.
6
  • signal handlers are not really a thing on Windows; are you using cygwin or mingw?
    – Igor Skochinsky
    Commented May 27, 2019 at 10:51
  • Well, I'm using Windows 10.
    – bart1e
    Commented May 27, 2019 at 10:52
  • what compiler are you using to build the program?
    – Igor Skochinsky
    Commented May 27, 2019 at 10:53
  • I'm using GCC. I'll update my question to contain this information.
    – bart1e
    Commented May 27, 2019 at 10:54
  • 1
    Targeting minGW.
    – bart1e
    Commented May 27, 2019 at 11:06

3 Answers 3

3

This technique is equivalent to the Structured Exception Handler for Windows. The application registers an exception handler, then forces an exception to occur, thereby transferring control to the exception handler. However, when a debugger is present, it will generally intercept the exception to allow user interaction. If your debugger allows you to pass the exception back to the program, then you will be able to continue tracing.

You can read more about the technique here: The "Ultimate" Anti-Debugging Reference (pdf)

1
  • Thank you for your answer and for posting a link to the great book. :) The thing is, I've already tried to pass the exception to the application by debugger (OllyDbg), but I just get message saying "Debugged program was unable to process exception" and the execution doesn't continue. I will update my question with a binary and with this information.
    – bart1e
    Commented Jun 1, 2019 at 8:49
1

Not sure if the exact answer you are looking for is in there, but this presentation is one of the best I have seen on this topic: https://www.blackhat.com/presentations/bh-usa-07/Yason/Presentation/bh-usa-07-yason.pdf

1
  • I didn't find the answer there, but it's good article nonetheless. Thank you for posting it.
    – bart1e
    Commented May 27, 2019 at 20:22
1

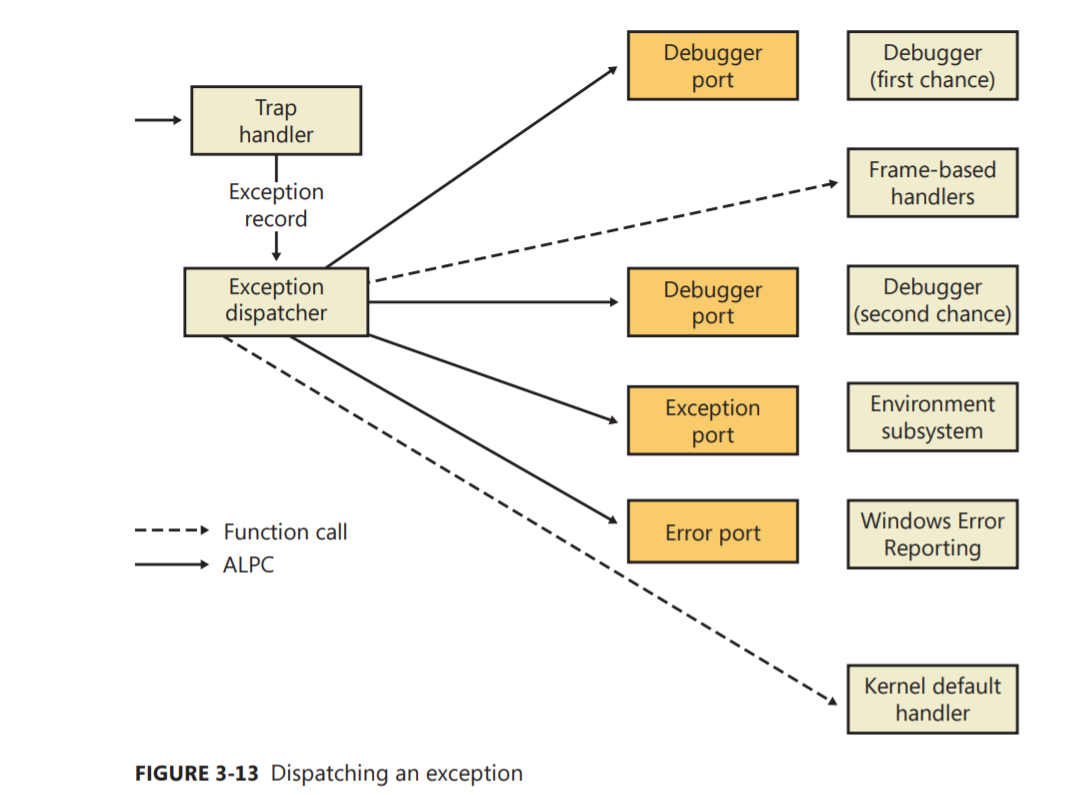
I think I have finally found an answer to this question. Since I didn't find an answer anywhere in the Internet (including MSDN documentation for signal, articles covering anti debuggging techniques and exception handling on Windows) and the problem existed in all debuggers tested (OllyDbg1/2, x64dbg, IDA debugger, radare2, gdb), I analysed exception handling mechanism described in Windows Internals 6th edition. Following image and cites come from this book, from page 126.

The exception dispatching process may be illustrated this way (actions will be performed from top to the bottom on the image): exception dispatching

Actions performed:

  1. the first action the exception dispatcher takes is to see whether the process that incurred the exception has an associated debugger process. If it does, the exception dispatcher sends a debugger object message to the debug object associated with the process (which internally the system refers to as a “port” for compatibility with programs that might rely on behavior in Windows 2000, which used an LPC port instead of a debug object).

  2. If the process has no debugger process attached or if the debugger doesn’t handle the exception, the exception dispatcher switches into user mode, copies the trap frame to the user stack formatted as a CONTEXT data structure [...], and calls a routine to find a structured or vectored exception handler

  3. If none is found or if none handles the exception, the exception dispatcher switches back into kernel mode and calls the debugger again to allow the user to do more debugging. (This is called the second-chance notification.)

  4. If the debugger isn’t running and no user-mode exception handlers are found, the kernel sends a message to the exception port associated with the thread’s process. This exception port, if one exists, was registered by the environment subsystem that controls this thread. The exception port gives the environment subsystem, which presumably is listening at the port, the opportunity to translate the exception into an environment-specific signal or exception. For example, when Subsystem for UNIX Applications gets a message from the kernel that one of its threads generated an exception, Subsystem for UNIX Applications sends a UNIX-style signal to the thread that caused the exception

  5. However, if the kernel progresses this far in processing the exception and the subsystem doesn’t handle the exception, the kernel sends a message to a systemwide error port that Csrss (Client/Server Run-Time Subsystem) uses for Windows Error Reporting (WER)

  6. executes a default exception handler that simply terminates the process whose thread caused the exception

Points 1., 2., 3., 5. and 6. aren't surprising. However, notice the point 4. It says, that if first three points didn't handle the exception and the debugger isn’t running, environment subsystem can translate the exception into an environment-specific signal which is then sent to the application.

But that only happens when a debugger is not attatched to the process and this explains why the exception handler was only called when the program was running outside a debugger. Otherwise, point 4. from the list above was simply not performed.

So, it wasn't simply SEH anti debugging technique (signal function doesn't add a handler to the SEH chain) - in fact it used a different concept and detected debugger in a different way.

Since I haven't found this anti debugging technique described anywhere, I hope this information will help someone, when he encounters such a technique during analysis.

And, since it is not stated in the book how OS checks whether an application is being debugged at point 4., it may be necessary to change the control flow of the program manually when an exception is being processed to force it to execute the handler.

1
  • I don't think point 4 applies, because you do have a handler which should be invoked. To get the full picture, you need to check how MinGW performs signal handling (how it translates OS exceptions into signals and in what context the signal handler executes). I'd suggest using a kernel debugger so the execution is not affected by user-mode debugger presence.
    – Igor Skochinsky
    Commented Jun 9, 2020 at 7:30

Your Answer

By clicking “Post Your Answer”, you agree to our terms of service and acknowledge you have read our privacy policy.

Not the answer you're looking for? Browse other questions tagged or ask your own question.