3

I debugging with IDA, and I want to see/print all the functions that get called.

In the functions window I see over than 1000 functions.

So I want to see which functions are called when I press enter or press on buttons and actions like that.

I use IDA, but if I can do it with another debugger, that's also okay.

3 Answers 3

3

Although you can use several tools, I would suggest you to use GDB if possible, since it has a built-in feature of breaking at each function call.

Now, what you can do, is to run your program two times - first, without pressing buttons, and second, with doing so. I'm attatching a python script that will print each function call with a number of calls to it, to the file named output. Feel free to use it for your purposes:

#!/usr/bin/env python3
import gdb
import re

breakpoints = []
gdb.execute('rbreak', to_string=True)
gdb.execute('run', to_string=True)
try:
    while True:
        a = gdb.execute('continue', to_string=True)
        reg = gdb.execute('info registers rip', to_string=True)
        b = reg.split()[1][2:]
        f = reg.split()[3]
        c = gdb.execute('info breakpoints', to_string=True).split('\n')
        d = [s for s in c if b in s]
        if len(d) > 1:
            sys.exit(1)
        e = d[0].split()[0].split('.')[0]
        gdb.execute('disable breakpoints ' + e)
        breakpoints.append(e)
        breakpoints.append(f)
except:
    f = open("output", "w+")
    [f.write(b + '\n') for b in breakpoints]
    f.close()

You can invoke it by running gdb name_of_your_program and then source gdb.py assuming that the script name is gdb.py.

After doing this two times, you will get two files: one containing all function calls, while not pressing buttons, and the other one containing function calls when buttons are being pressed. Simply running diff on this files will reveal which functions are responsible for button press handling.

If, for some reason you cannot use GDB, this answer shows the way it can be done in radare2.
1

Usually, debuggers (IDA included) provide tracing functionality. This is logging debugee's actions at a predefined granularity level. That could be logging all individual instructions, or as you desire, function calls. Using function tracing (Debugger -> Tracing -> Function Tracing) a user is able to view all functions called throughout the tracing duration. Keep in mind this may generate a big trace, and logging it to a file may be recommended.

1

In addition to Nirlzr's answer, you can go to the function Imports window in the debugger (IDA, OllyDbg and x64Dbg for example), and set a breakpoint on the functions you are curious about. Then, simply run the program and the debugger will stop the execution of the program at the time each function is called.

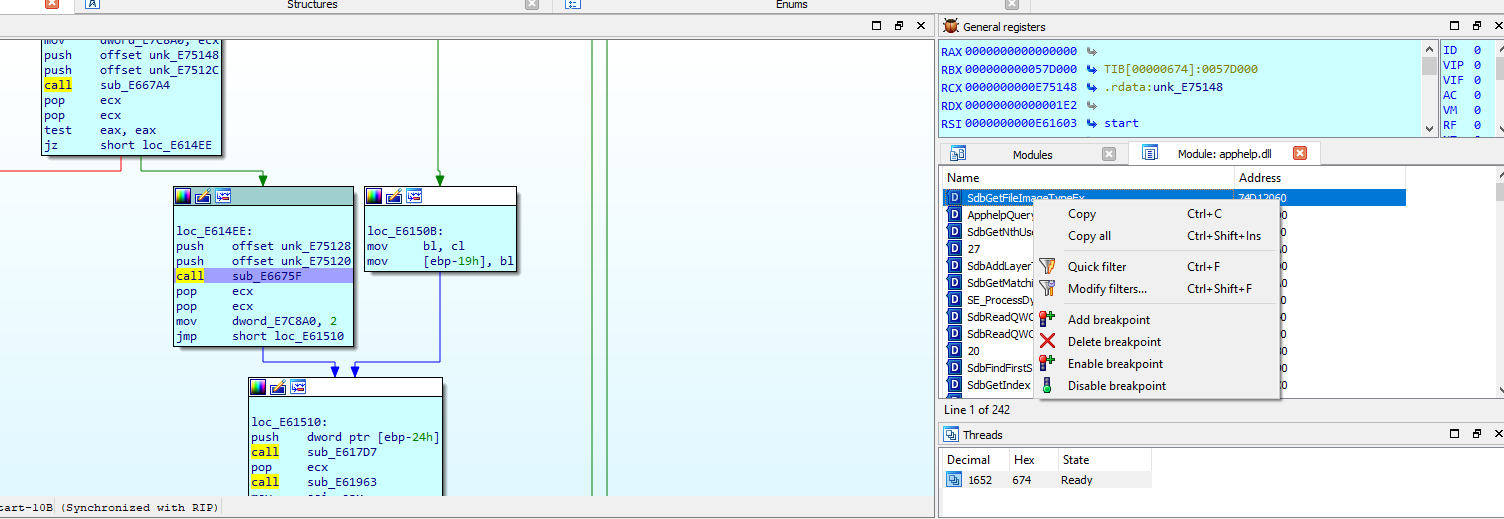
For example, if you want to see when a program calls CreateProcessInternalW, you can go into the function import table (sometimes called "symbols") and set breakpoints on the function listed there. Now, when a program creates a new process, the debugger will break execution at that point so you can see the arguments passed and return value. For convenience, I've attached a screenshot of this in IDA Pro - pay attention to the right side of the screen where I have the function list of apphelp.dll which I got to by finding it in the "Modules" window and then double-clicking the DLL file name. Now we can right-click on a specific function like I've shown and click "Add Breakpoint", then run the program. This is only available in the IDA Debugger once the debugger has been started.

NOTE: Sometimes the imports are not fully resolved at the beginning of the program, so as you continue through the program, more of these functions will become available to break on.enter image description here

Your Answer

By clicking “Post Your Answer”, you agree to our terms of service and acknowledge you have read our privacy policy.

Not the answer you're looking for? Browse other questions tagged or ask your own question.