1

I'm reverse engineering the Final Fantasy XIV 1.0 protocol to bring back the now dead game (not ARR). I'm trying to find where an error message handler is called (specifically "This character name is already in use"), and work backwards to send the correct packet. Using the timeout error message, I found the routine that causes this message to load, but the routine is never called as a constant, rather loaded into EDX and then called. A error code is passed in which defines what message to show, as well as what action to take (for example, putting in the "Bad chara name" code will actually cause the UI to switch to the "enter name" screen).

I'm using ollydbg and normally I'd just use the "find references to command" option, but since this routine is loaded then called, that won't work. Any ideas how to find where this routine is called? Then I can work backwards to find what is read from the packet to go to that code.
5
  • Add a breakpoint at the beginning of this function and then look at the call stack when it fires?
    – s3c
    Commented Aug 28, 2015 at 14:48
  • 2
    @s3c: Since he says the game is now dead, i assume the OP doesn't have a server to connect to, so he can't trigger this specific error message in the client, just different error messages, so dynamic analysis won't help much. Commented Aug 28, 2015 at 14:50
  • Yup, as Guntram said, I can't test against a server to see what causes said messages to appear. Was able to get most of the character creation stuff working though. When the game timeouts, it loads a constant value (30001 in hex into ESP+0x70 iirc), loads the routine address into EDX, then does a CALL. The value is index in one of the game's data tables storing all the error messages. Some I can find, but it seems the "Character name in use" id comes from the server.
    – Ioncannon
    Commented Aug 28, 2015 at 15:07
  • do you have IDA? it'd make the analysis much simpler
    – rev
    Commented Aug 28, 2015 at 15:17
  • I do have an old copy but only tried it once. Will give it a go again and see if I can find where the code branches. Any features I should specifically lookout for?
    – Ioncannon
    Commented Aug 28, 2015 at 15:23

1 Answer 1

0

You must set hardware breakpoint on execute in that address:

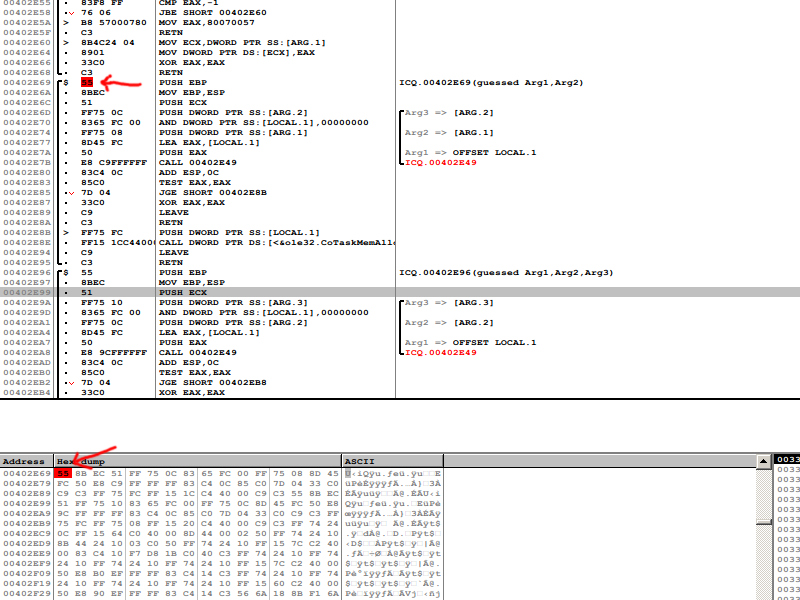
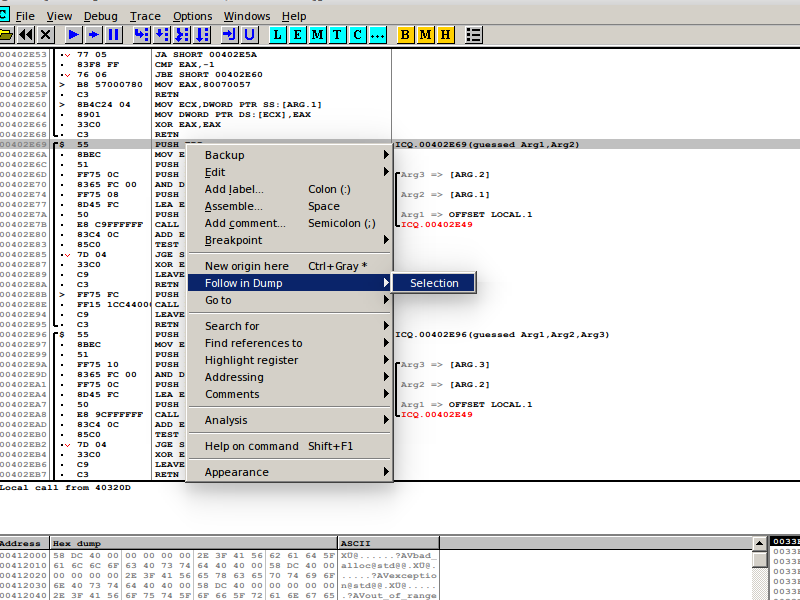
first find your tracing routine and flow in dump:

enter image description here

then create hwbp:

enter image description here

set on execute on the first byte of this routine :

enter image description here

now when call to this function ollydbg show the call:

enter image description here

Your Answer

By clicking “Post Your Answer”, you agree to our terms of service and acknowledge you have read our privacy policy.

Not the answer you're looking for? Browse other questions tagged or ask your own question.