I am trying to reverse engineer something which appears to purposely create exceptions as part of its logic. In the image below, there are multiple DIV EAX commands that generate division by 0 exceptions because the value of EAX is set to 0. I told the debugger to send them back to the application. Since the application has some anti-reverse-engineering functionality, I am guessing that the command itself is for obfuscation while the real logic sits in the exception handler, which retries the command at the same address multiple times, and changes the values in other registers. However, the run trace in OllyDbg does not show the commands from this exception handler, and using 'Step Into' also does not work. How can I enable tracing and/or stepping through code in the exception handler?
1 Answer
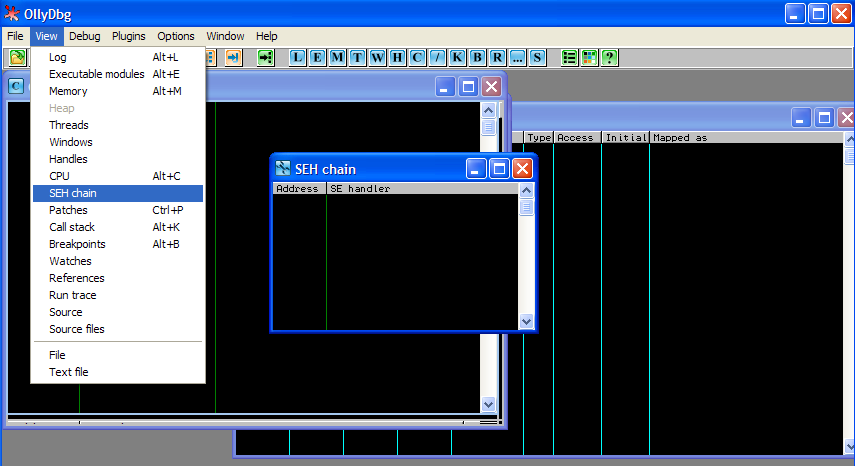
You can see the list of SEH Chain in the View tab -> SEH Chain. Just set a breakpoint at the address of SEH.

