no there is no shortcut loader knows only about the $exentry because it is an embedded pointer in the PeHeader
from there to main is mostly traversed by either single stepping or observing and recognizing known functions by practice and experience
the crt code is fairly common and the source for crt is available in crt folder of any visual studio installation (this will help if you have the binary with debug info
if the binary is stripped or built without debuginfo in release mode crt src wont help you pinpoint the main()
in those case you should be able to recognize certain standard calls that the crt is going to make for example it would normally call kernel32!GetCommandLineXXXX settig a bp on that function brings you closer to the main() another function you can set a breakpoint is
kernel32!GetEnvironemStringXXXX
and then set hardware breaks on the results
once you have hit these breakpoints you can
you can use the standard prototype of main
int main (int argc , char **argv , char* envp) construct to
identify your main
:\>cdb -c "bp $exentry;g;bp kernel32!GetCommandlineA;g;g poi(@esp)" hell.exe

0:000> cdb: Reading initial command 'bp $exentry;g;bp kernel32!GetCommandlineA;g;g poi(@esp)'
Breakpoint 0 hit
Breakpoint 1 hit
eax=002b36d8 ebx=7ffdf000 ecx=002b47e8 edx=002b4813 esi=00000000 edi=00000000
eip=01314082 esp=0024f9b0 ebp=0024f9e4 iopl=0         nv up ei pl zr na pe nc
cs=001b  ss=0023  ds=0023  es=0023  fs=003b  gs=0000             efl=00000246
image01310000+0x4082:
01314082 a3c4933201      mov     dword ptr [image01310000+0x193c4 (013293c4)],ea
x ds:0023:013293c4=00000000
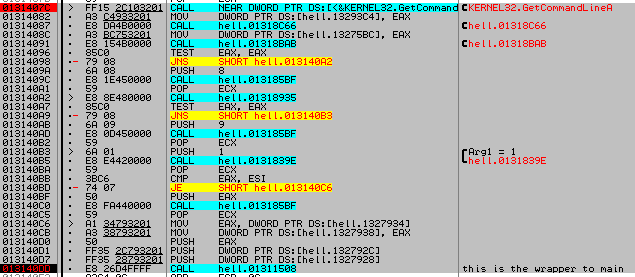
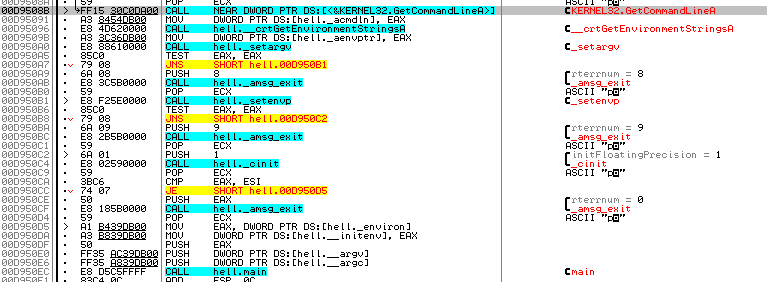
the same area and the distance between exec_main and getcommandline function as an image of ollydbg debugging the same executable

the same src built with debuginfo /Zi msvc compiler and snap shotted

to get more nearer you can employ the int argc
you execute the binary so you know how many arguments you passed
if you passed no arguments to the binary then int argc will be equal to 1
if you passed 8 arguments int argc will be equal to 9
with that in mind once you reached the breakpoint as enumerated above you can run a loop that enumerates the int argc in stack
bp $exentry
bp kernel32!GetCommandLineA
g
g
g poi(@esp)
.while(@$t0= 0) {
pc
.if ( poi(@esp) == 1) {r $t0 = 1} .else { r $t0 = 0}
}
result of running the script notice the address in screen shot above you have just one call to step to the wrapper for main()
cdb -c "$$>a< findwmain.txt" hell.exe

0:000> cdb: Reading initial command '$$>a< findwmain.txt'
Breakpoint 0 hit
Breakpoint 1 hit

eax=00000000 ebx=7ffd3000 ecx=00461228 edx=00461228 esi=00000000 edi=00000000
eip=000a40b5 esp=0034fb5c ebp=0034fb94 iopl=0         nv up ei pl zr na pe nc
cs=001b  ss=0023  ds=0023  es=0023  fs=003b  gs=0000             efl=00000246
image000a0000+0x40b5:
000a40b5 e8e4420000      call    image000a0000+0x839e (000a839e)

