2

How do I go into the thread function (so I can do step by step tracing), knowing only the handle to the thread. I am using OllyDbg for tracing and the thread is created through the API ZwCreateProcess(). However, the documentation that I have seen for this API does not contain the creation flags and pointer to the defined function which it will execute, which I both need.

Is there a way to go into the thread function, knowing only the thread handle? Also, are there other ways to create suspended threads aside from CreateThread() and CreateRemoteThread()?

4
  • Can you check whether there was a previous call to CreateProcess* API which created the process in suspended state? What do you mean by "limits my ability to see"?
    – PhoeniX
    Commented Mar 9, 2015 at 15:41
  • Actually I've just seen the thread creation API which is ZwCreateProcessEx. However, I cannot find any documentation as to the definition of the parameters of this API, thus I can't still see the thread function itself.
    – jowabels
    Commented Mar 10, 2015 at 5:45
  • As you are not providing enough information I'll try to guide you: 1. place break point (BP) on CreateProcessW and ZwCreateProcessEx to check what API is actually called to create the process. 2. Place BP on GetThreadContext and check whether it was hit. Please provide answers to that so we can provide meaningful answer for your context.
    – PhoeniX
    Commented Mar 10, 2015 at 8:43
  • I'm sorry for having insufficient info. As for your question, ZwCreateProcessEx was used to create the process and GetThreadContext was hit afterwards.
    – jowabels
    Commented Mar 10, 2015 at 11:04

3 Answers 3

3

Is there a way to go into the thread function, knowing only the thread handle?

Yes, it's a 2-step process.

Step 1 - Convert the thread handle to a thread ID

In Process Explorer's menu bar, check the following:

  • ViewShow Lower Pane
  • ViewLower Pane ViewHandles
  • ViewSelect Columns...Handle tab → check all checkboxes

Next, select your target process in Process Explorer's list of processes. You'll then see in the lower pane the list of handles for that process, including thread handles. Find the thread ID associated with your target handle. For the example below, thread handle 0x228 is associated with thread ID 3000:

Handle to ID

Though handle values are shown in hexadecimal in Process Explorer, thread IDs are shown in decimal. Thus thread ID 3000 in decimal is equal to thread ID 0xBB8 in hexadecimal.

Step 2 - Find EIP for the thread ID

In OllyDbg's menu bar, select ViewThreads. Right-click on the thread whose Ident corresponds to the thread ID you found in Step 1 (0xBB8 in the example below), and select Show registers:

Threads

This will show you the current EIP for that thread, which is the next instruction to be executed once that thread is resumed:
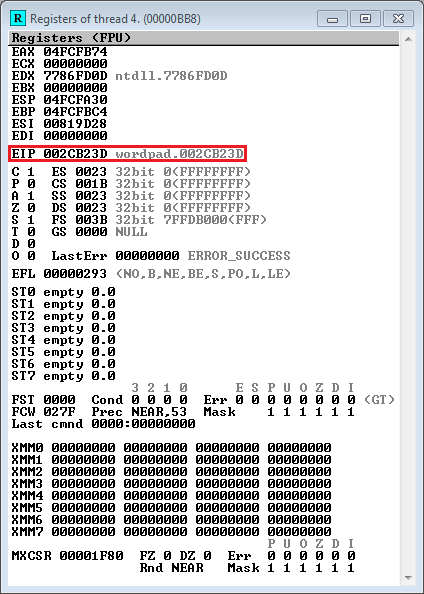
Registers

Alternative Step 2 - Find EIP for the thread ID

If the target thread was created in a suspended state and not yet resumed then the thread won't show up in OllyDbg's thread window. In this case, you can use LiveKd to find the thread's starting address by issuing the LiveKd command !thread -t <thread ID in hexadecimal>

kd> !thread -t BB8
Cid handle table at 88e01108 with 944 entries in use

THREAD 86B4E548  Cid 169c.0bb8  Teb: 7ffdb000 Win32Thread: 00000000 WAIT: (Suspended) KernelMode Non-Alertable
SuspendCount 1
FreezeCount 1
    86b4ec28  Semaphore Limit 0x2
Not impersonating
DeviceMap                 9a70f9e8
Owning Process            86b4cd40       Image:         wordpad.exe
Attached Process          N/A            Image:         N/A
Wait Start TickCount      21829348       Ticks: 1299 (0:00:00:20.264)
Context Switch Count      1              IdealProcessor: 0
UserTime                  00:00:00.000
KernelTime                00:00:00.000
Win32 Start Address 0x002cb23d
Stack Init 8b777ed0 Current 8b777a40 Base 8b778000 Limit 8b775000 Call 0
Priority 8 BasePriority 8 UnusualBoost 0 ForegroundBoost 0 IoPriority 2 PagePriority 5
ChildEBP RetAddr  Args to Child
8b777a58 82a88d3d 85807a60 00000000 82b35d20 nt!KiSwapContext+0x26 (FPO: [Uses EBP] [0,0,4])
8b777a90 82a87b9b 85807b20 85807a60 85807c28 nt!KiSwapThread+0x266
8b777ab8 82a8158f 85807a60 85807b20 00000000 nt!KiCommitThreadWait+0x1df
8b777b34 82abbfd9 85807c28 00000005 00000000 nt!KeWaitForSingleObject+0x393
8b777b4c 82abbaf4 00000000 00000000 00000000 nt!KiSuspendThread+0x18 (FPO: [3,0,0])
8b777b90 82e2390f 00000000 00000000 00000000 nt!KiDeliverApc+0x17f
8b777bb0 82e23b29 00000001 00000000 00000000 hal!HalpDispatchSoftwareInterrupt+0x49 (FPO: [Non-Fpo])
8b777bc8 82e23ba9 00000000 00000000 8b777c20 hal!HalpCheckForSoftwareInterrupt+0x83 (FPO: [Non-Fpo])
8b777bd8 82c6450d b553bcc6 00000000 00000000 hal!KfLowerIrql+0x61 (FPO: [Non-Fpo])
8b777c20 82abb559 00000000 778870d8 00000001 nt!PspUserThreadStartup+0x14
00000000 00000000 00000000 00000000 00000000 nt!KiThreadStartup+0x19

You can see Win32 Start Address 0x002cb23d in the output above, which is the starting address for the suspended thread.

Also, are there other ways to create suspended threads aside from CreateThread() and CreateRemoteThread()?

Yes, you can call ntdll!NtCreateThread() or ntdll!NtCreateThreadEx().

5
  • Does this apply to suspended threads or processes? OllyDbg does not seem to show the thread that I wanted to see. Using the steps outlined above, I have seen this thread in Process Explorer but not in Olly.
    – jowabels
    Commented Mar 10, 2015 at 5:50
  • if the CreateThread used CREATE_SUSPENDED ollydbg will not show the thread nor its registers only on subsequent SuspendThread / Resume Thread combo ollydbg will show the thread see my other answer for some work around
    – blabb
    Commented Mar 10, 2015 at 6:15
  • I've updated my answer above with an alternative solution that works for threads that were created in a suspended state. Commented Mar 10, 2015 at 13:35
  • @JasonGeffner Win32StartAddress is static initialized once it will not reflect the Threadprocs eip on subsequent resumes try sleeping in the threadproc and checking nt!_ethread Win32StartAddress
    – blabb
    Commented Mar 11, 2015 at 10:08
  • @blabb, the LiveKd approach above is only for the situation where the thread had never been resumed after being created in a suspended state. Otherwise, the OllyDbg approach above can be used. Commented Mar 11, 2015 at 14:13
0

Based on provided information I suspect that the used method here is Dynamic forking of a process or as it also know process hollowing. The idea is to execute some arbitrary process in suspended state and replace its "guts" with the contents of another executable image. In general the idea could be implemented as following (based on Dynamic forking by Tan Chew Keong, 2004):

  1. Use the CreateProcess API with the CREATE_SUSPENDED parameter to create a suspended process from any EXE file. (Call this the first EXE).
  2. Call GetThreadContext API to obtain the register values (thread context) of the suspended process. The EBX register of the suspended process points to the process's PEB. The EAX register contains the entry point of the process (first EXE).
  3. Obtain the base-address of the suspended process from its PEB, i.e. at [EBX+8]
  4. Load the second EXE into memory (using ReadFile) and perform the neccessary alignment manually. This is required if the file alignment is different from the memory alignment
  5. If the second EXE has the same base-address as the suspended process and its image-size is <= to the image-size of the suspended process, simply use the WriteProcessMemory function to write the image of the second EXE into the memory space of the suspended process, starting at the base-address.
  6. Otherwise, unmap the image of the first EXE using ZwUnmapViewOfSection (exported by ntdll.dll) and use VirtualAllocEx to allocate enough memory for the second EXE within the memory space of the suspended process. The VirtualAllocEx API must be supplied with the base-address of the second EXE to ensure that Windows will give us memory in the required region. Next, copy the image of the second EXE into the memory space of the suspended process starting at the allocated address (using WriteProcessMemory).
  7. If the unmap operation failed but the second EXE is relocatable (i.e. has a relocation table), then allocate enough memory for the second EXE within the suspended process at any location. Perform manual relocation of the second EXE based on the allocated memory address. Next, copy the relocated EXE into the memory space of the suspended process starting at the allocated address (using WriteProcessMemory).
  8. Patch the base-address of the second EXE into the suspended process's PEB at [EBX+8].
  9. Set EAX of the thread context to the entry point of the second EXE.
  10. Use the SetThreadContext API to modify the thread context of the suspended process.
  11. Use the ResumeThread API to resume execute of the suspended process.

So, to answer your question I firstly suggest to verify that this indeed happens. Secondly, if it does you can do the following to break on the new created thread entry point. The proposed way is not the only one, but IMHO will be easy done taking into account your relatively small experience in RE/executable analysis:

  • Check the PoC to actually get the full understanding of the whole process.

    1. Place BP on SetThreadContext. The second parameter is CTX variable which holds among various aspects of the thread context, also the address of the thread function.
    2. In the nutshell, you need to examine CTX.eax to get the address of the thread function. For example 0x00402030 is the address you've found there.
    3. Download and install ProcessHacker and with its help, examine the address space of the suspended process. Open the memory page to which the thread function belongs to - Right click on process -> Properties -> Memory. For example page 0x00400000.
    4. ProcessHacker will show you the memory page with local offsets to the page. You will need to go to the offset 0x2030.
    5. Patch the memory at offset 0x2030 with 0xEBFE (remember the previous bytes), this makes the thread loop indefinitely - jmp 0x00402030.
    6. Now, resume the parent process and attache the new instance of Olly to the suspended process which now is already running. Go to the EP and patch back to the original bytes.
    7. Good luck with the analysis.

I hope this is understandable otherwise ask and I'll clarify.

0

if the Thread is Created Suspended and Resume thread is called for the first time ollydbg will not show the thread in its thread window nor will the stack trace for the thread be available in stack window (ALT+K)->Right Click->Thread ->Checkmark

in such cases you can set a breakpoint on the following apis

follow through is based on xp sp3 layout (you may need a bit of tweking in newer os )

1) ntdll!NtContinue / ZwContinue  (can be found without symbol )    
2) ntdll!ZwRegisterThreadTerminateport (can find this too without symbol)    
3) CsrNewThread  (needs symbol)   
4) BaseThreadStartThunk ditto    
5) BaseThreadStart  ditto     

Resume thread will break on either of these apis

if it is broken on Zw/Nt Continue follow the context->eip from the stack [[esp+4] + 0xb8] and set a breakpoint on the eip found (this address normally will be BaseThreadStartThunk which is directly identifiable if you have public symbols loaded ) and hit go once you are on BaseThreadStartThunk single step f8 few times until you get to an indirect call call dword ptr ds:[R32 + CONST] this is your ThreadProc

if it is broken on ZwRegisterTerminatePort you need to just single step (you will return to csrNewThread which you can find if symbols are available) and keep f8ing until you get to the indirect call stated above to land on ThreadProc

the other apis are included in the above and can reduce the number of single step

ntdll!ZwRegisterThreadTerminatePort is the closest break prior to ThreadProc

needs one ctrl+f9 (execute until return) and 3 f8 (single step)

if windbg / livekd is an option this script can retrieve the eip when broken on ResumeThread call be it Firsttime Resume or subsequent resumes

.foreach /ps 8 /pS 0n19 (place { !process 0 4 ${$arg1} } ) {.printf "ETHREAD = %x\n", place ; r? $t0 =  (((nt!_ETHREAD *) @@masm( place ))->Tcb) ; r? $t1 = @$t0.StackLimit;r? $t2 = @$t0.InitialStack;.foreach (vlace {s -[1]d @$t1 @$t2 0x23 0x23 } ) {dt nt!_KTRAP_FRAME DbgEip Eip  @@masm(${vlace}-34) }}

Your Answer

By clicking “Post Your Answer”, you agree to our terms of service and acknowledge you have read our privacy policy.

Not the answer you're looking for? Browse other questions tagged or ask your own question.