5

I have a heavily obfuscated Windows service binary. Fields, types and methods are renamed. While it is possible to decompile the binary using dnSpy, it is still very cumbersome to identify important/interesting locations statically.

Is it possible to dynamically instrument the binary in order to gain a deeper understanding of certain execution paths? I don't know a lot about CLR internals but my understanding is that instrumentation is not easily possible because of JIT compilation of IL instructions.

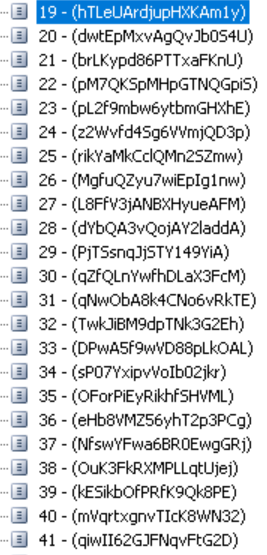
If anybody has suggestions for tracing execution paths in the binary, I'd highly appreciate your input. Additionally, if anybody has seen a similar obfuscation scheme before, please let me know:

enter image description here

Edit: The sample can be downloaded from: https://gofile.io/?c=qrNky4 (not malicious; part of a VPN software)

3
  • 1
    Is it possible you share the binary so it's easier to showcase potential solution on this real example? Commented Oct 25, 2019 at 15:13
  • I have uploaded the binary to gofile.io/?c=qrNky4 - It is public and not malicious; it's actually part of a VPN service.
    – DucatiNerd
    Commented Oct 26, 2019 at 18:56
  • 1
    Little note: The obfuscator used is (likely) .NET Reactor, there is public tools for deobfuscating it but they might not work on newer versions.
    – 3dsboy08
    Commented Oct 31, 2019 at 16:02

2 Answers 2

5
+50

that instrumentation is not easily possible because of JIT compilation of IL instructions.

Well it's actually the opposite. Tracing methods is quite easy - it would be difficult if we would like to trace fields usages. .NET assemblies contain rich type/method information that can be used to inspect/modify them. There's also a great library that does that plus more - Mono.Cecil.

With the help if this library we can achieve what you want (gist).

using System;
using System.IO;
using System.Linq;
using Mono.Cecil;
using Mono.Cecil.Cil;

class TraceIL
{
    static void Main(string[] args)
    {
        if (args.Length != 1)
        {
            Console.WriteLine("TraceIL.exe <assembly>");
            return;
        }

        string fileName = args[0];
        ModuleDefinition module = ModuleDefinition.ReadModule(fileName);
        MethodReference consoleWriteLine =
            module.ImportReference(typeof(Console).GetMethod("WriteLine", new Type[] {typeof(object)}));
        foreach (TypeDefinition type in module.Types)
        {
            foreach (var methodDefinition in type.Methods)
            {
                var ilBody = methodDefinition.Body;
                var ilProcessor = ilBody.GetILProcessor();

                var firstOp = methodDefinition.Body.Instructions.First();
                var ldstrEntering = Instruction.Create(OpCodes.Ldstr, $"--Entering {methodDefinition.Name}");
                ilProcessor.InsertBefore(firstOp, ldstrEntering);
                var call = Instruction.Create(OpCodes.Call, consoleWriteLine);
                ilProcessor.InsertBefore(firstOp, call);
                var ldstrLeaving = Instruction.Create(OpCodes.Ldstr, $"--Leaving {methodDefinition.Name}");
                var lastOp = methodDefinition.Body.Instructions.Last();
                ilProcessor.InsertBefore(lastOp, ldstrLeaving);
                ilProcessor.InsertBefore(lastOp, call);
            }
        }
        module.Write(Path.GetFileNameWithoutExtension(fileName)+".modified"+Path.GetExtension(fileName));
    }
}

Just to explain a little bit what's going on. For every method on every type we find in the assembly, we get the ILProcessor that allows us to modify the code. Having that we just insert a string and a call to Console.WriteLine just before the first existing opcode, and similar code just before the end of the method. At the very end we save the new binary under the same name with .modified added.

The example run:

λ TestApp.exe
Inside Run
Inside Inside
MoreInside
OtherProgramRun

λ TraceIL.exe TestApp.exe

λ TestApp.modified.exe
--Entering Main
--Entering .ctor
--Leaving .ctor
--Entering Run
Inside Run
--Entering Inside
Inside Inside
--Entering MoreInside
MoreInside
--Entering .ctor
--Leaving .ctor
--Entering OtherProgramRun
OtherProgramRun
--Leaving OtherProgramRun
--Leaving MoreInside
--Leaving Inside
--Leaving Run
--Leaving Main

Of course form there you can do some crazy stuff, like adding timestamp and/or list passed arguments, etc. Since your sample is obfuscated it might not work form the start, but I guess this code is not that difficult to be modified as needed.
2
  • Thank you very much for your clear explanation. That is definitely something I will look into!
    – DucatiNerd
    Commented Oct 26, 2019 at 18:55
  • @DucatiNerd I've tried with this file and I can see there's some tricks that would have to be removed in order to instrumentation work. There's for example jump over some invalid calls that make this module impossible to save after instrumenting Commented Oct 28, 2019 at 19:34
3

You can use de4dot (https://github.com/0xd4d/de4dot) to deobfuscate the binary. Static analysis of dotnet binaries can be done easily by using de4dot and then using ILSpy to create a visual studio project, then you can analyze the source code in visual studio. You can also use dnSpy which allows you to debug the binary easily.

About the instrumentation, a dotnet binary still runs native code at runtime, with all the normal Win32 libraries. You can use Api Monitor (http://www.rohitab.com/downloads) to monitor os api calls at runtime, it's an awesome tool that works by hooking libraries and decoding parameters.

Moreover you can use procmon to display simple information like file system operations, registry, etc..

Good luck

4
  • d4dot was actually one of the first tools i tried out. Surprisingly, in this case, it did not detect the obfuscation scheme and was not able to deobfuscate the binary.
    – DucatiNerd
    Commented Oct 26, 2019 at 18:51
  • Can you share the sample? :)
    – oridamari
    Commented Oct 26, 2019 at 20:35
  • Check my reply to my question above. I have linked the file :)
    – DucatiNerd
    Commented Oct 26, 2019 at 23:02
  • 1
    This may be .NET reactor, I think I recognize the control-flow flattening from a previous sample where de4dot did detect it. Commented Nov 1, 2019 at 3:18

Your Answer

By clicking “Post Your Answer”, you agree to our terms of service and acknowledge you have read our privacy policy.

Not the answer you're looking for? Browse other questions tagged or ask your own question.