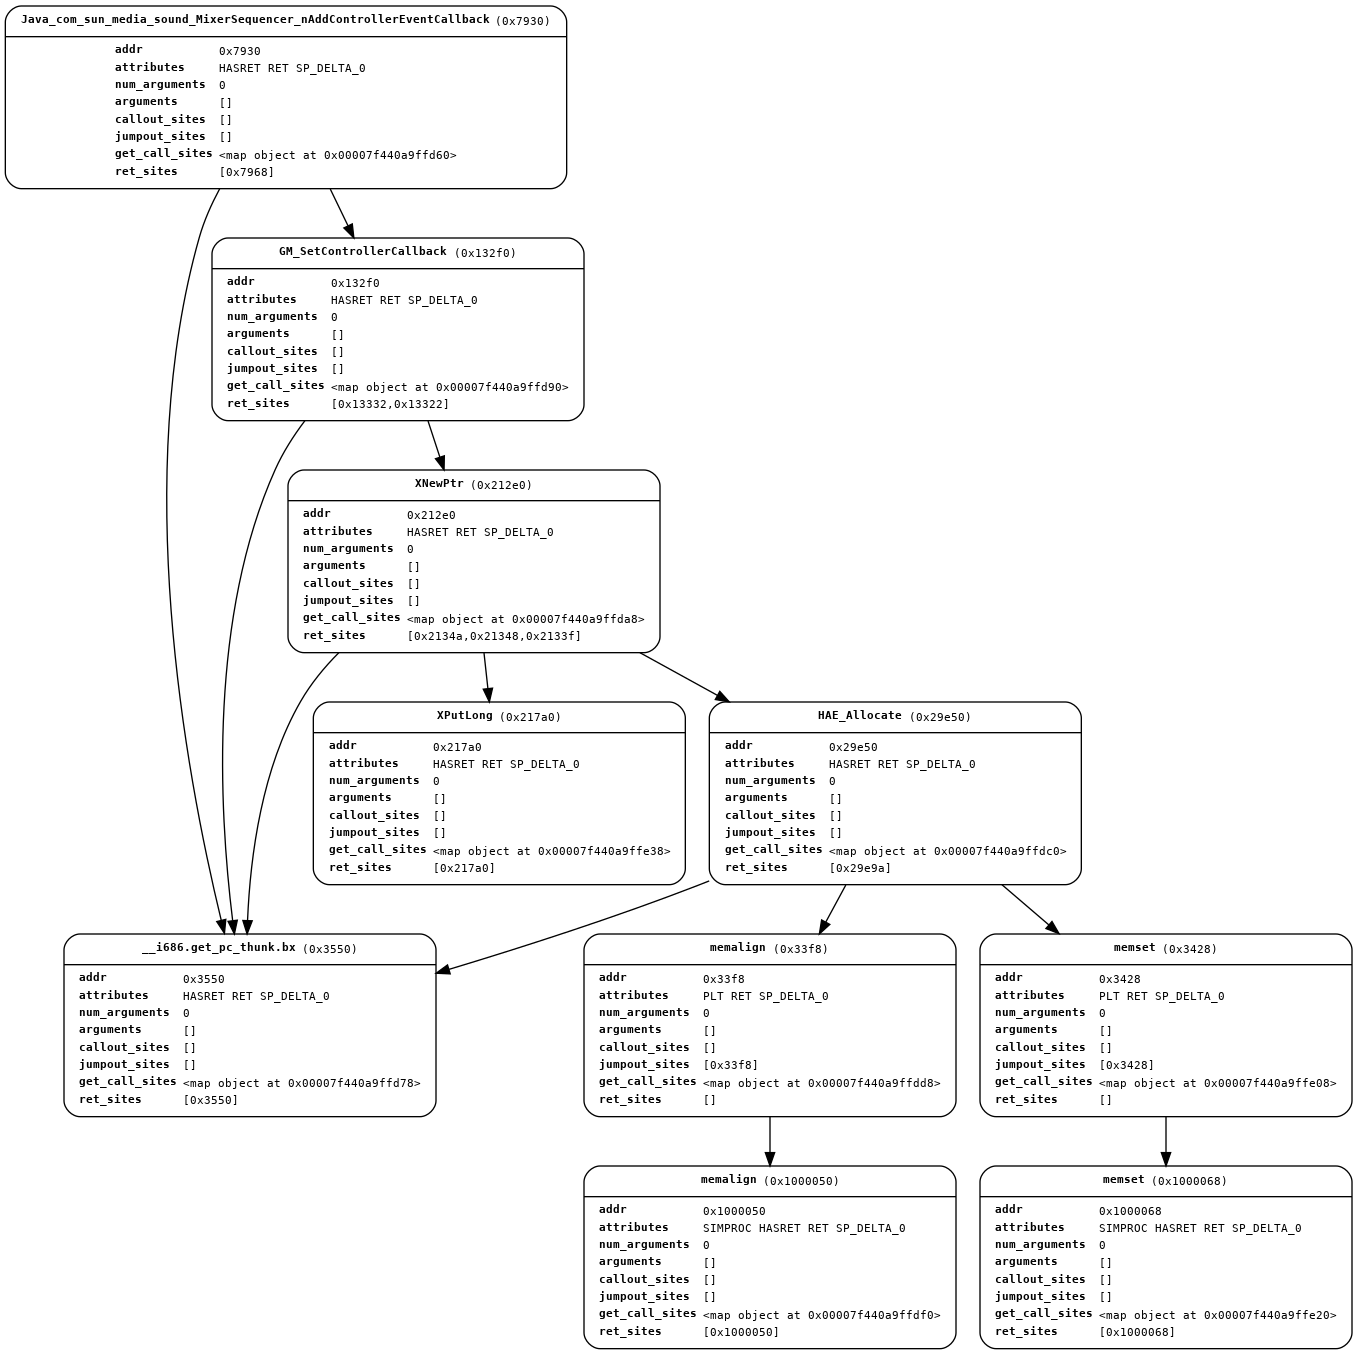
You can use radare2 or one of the alternatives below to generate a full call-graph in dot format.
radare2 Installation
First of all, install radare2 from git repository:
$ git clone https://github.com/radare/radare2.git
$ cd radare2
$ ./sys/install.sh
Analysis
After you've downloaded and installed radare2, open your binary and perform analysis on it using the aaa command:
$ r2 /bin/ls
[0x004049a0]> aaa
[x] Analyze all flags starting with sym. and entry0 (aa)
[x] Analyze function calls (aac)
[x] Analyze len bytes of instructions for references (aar)
[x] Constructing a function name for fcn.* and sym.func.* functions (aan)
[x] Type matching analysis for all functions (afta)
[x] Use -AA or aaaa to perform additional experimental analysis.
Output visual graph
The ag command and subcommands can help you to output the visual graph into Graphviz format.
[0x00000000]> ag?
Usage: ag<graphtype><format> [addr]
Graph commands:
| aga[format]             Data references graph
| agA[format]             Global data references graph
| agc[format]             Function callgraph
| agC[format]             Global callgraph
| agd[format] [fcn addr]  Diff graph
| agf[format]             Basic blocks function graph
| agi[format]             Imports graph
| agr[format]             References graph
| agR[format]             Global references graph
| agx[format]             Cross references graph
| agg[format]             Custom graph
| ag-                     Clear the custom graph
| agn[?] title body       Add a node to the custom graph
| age[?] title1 title2    Add an edge to the custom graph

Output formats:
| <blank>                 Ascii art
| *                       r2 commands
| d                       Graphviz dot
... <truncated> ...
| w [path]                Write to path or display graph image (see graph.gv.format and graph.web)
You're searching for the agCd command. The C specifies to output a full ("global") call-graph of the program. The d specifies to output in Graphviz dot format.
[0x004049a0]> agCd > output.dot
The dot utility is part of the Graphviz software which can be installed using sudo apt-get install graphviz.
You can view your output in any offline dot viewer, paste the output into an online Graphviz viewer and even convert the dot file to PNG:
$ r2 /bin/ls
[0x004049a0]> aa
[x] Analyze all flags starting with sym. and entry0 (aa)
[0x004049a0]> agCd > output.dot
[0x004049a0]> !!dot -Tpng -o callgraph.png output.dot
To read more about radare2 it is recommended to read radare2 book.
Alternatives
gen-callgraph - gen-callgraph is a script to generate call graph from elf binary
IDA Pro - generate GDL (Graph Description File) call graph using CTRL+F12, save it and then convert it to dot file with one of the following options:
The free version of IDA is also capable of generate GDL of call graph but it is only available as exe, use wine on Linux to run it
