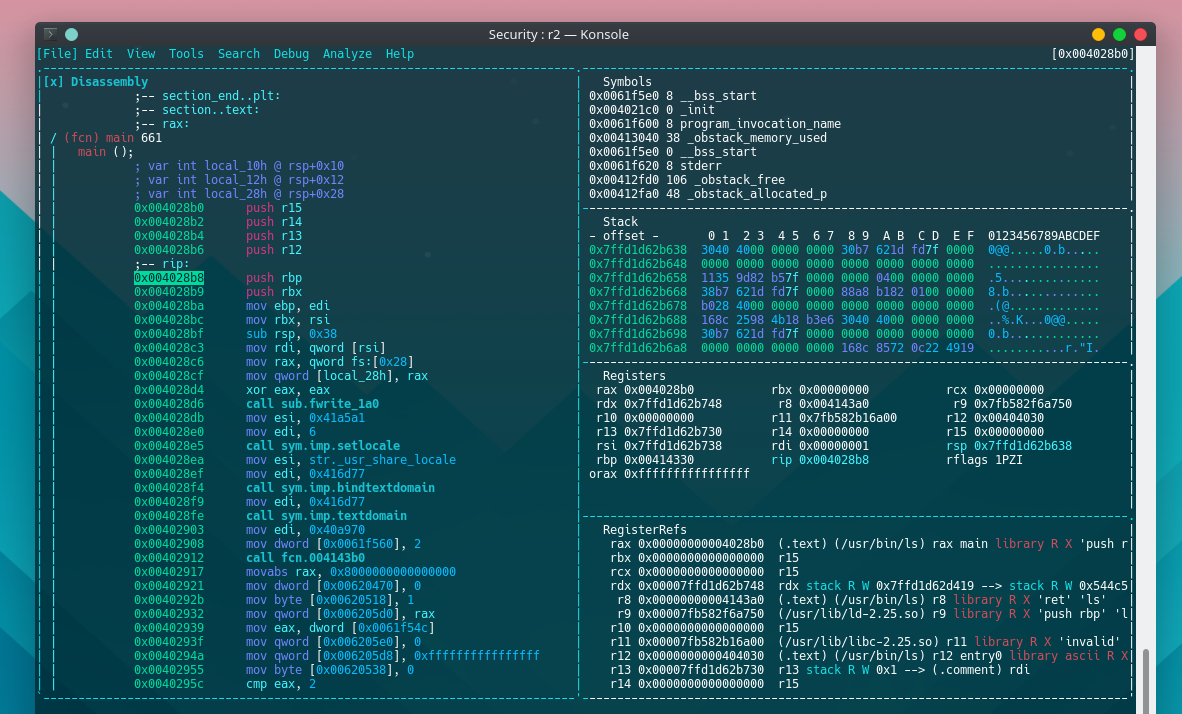
By stack I mean the location where local variable, return address etc are stored. Which is pointed to by the esp and ebp.
-
github.com/eteran/edb-debugger/wiki/Stack-View– julian ♦Commented Jul 31, 2017 at 0:29
-
look for gdbinit by various authors like mammon they usually decipher and print the stack contents or simply write a script with x/x *(long *) esp , esp+4 and run it on every step,– blabbCommented Jul 31, 2017 at 3:13
3 Answers
You can easily view it using Visual Panels in radare2. Here's a teaser:
Installation
First of all, install radare2 from git repository:
$ git clone https://github.com/radare/radare2.git
$ cd radare2
$ ./sys/install.sh
Debugging
To debug a program with radare2 call it with the debug flag -d:
$ r2 -d /bin/ls
Now the program is opened in debug mode.
Use v! to show the Visual Panel modes. Now you can see the assembly at the left and the stack panel at the right. You can step into and step over using s or S accordingly. Use ? to list more commands in the Visual Panels mode.
Some more ways to display the stack
pxa @ rsp- to show annotated hexdumppxw @ rsp- to show hexadecimal words dump (32bit)pxq @ rsp- to show hexadecimal quad-words dump (64bit)ad@r:SP- to analyze the stack data
To read more about debugging with radare2 it is recommended to read radare2 book and especially the Basic Debugger Session chapter.
You can use gdb, for example let see this simple program
#include <stdio.h>

int main(){
  printf("hello world\n");
  return 0;
}
Compile it
gcc -o simple simple.c -g
Run with gdb
gdb ./simple
Set a breakpoint in the main function and run
(gdb) b main
(gdb) r
And now we can look at the registers contents
(gdb) i r
rax            0x400526 0x400526
rbx            0x0  0x0
rcx            0x0  0x0
rdx            0x7fffffffe518   0x7fffffffe518
rsi            0x7fffffffe508   0x7fffffffe508
rdi            0x1  0x1
rbp            0x7fffffffe420   0x7fffffffe420
rsp            0x7fffffffe420   0x7fffffffe420
r8             0x4005b0 0x4005b0
r9             0x7ffff7de78e0   0x7ffff7de78e0
r10            0x846    0x846
r11            0x7ffff7a2e740   0x7ffff7a2e740
r12            0x400430 0x400430
r13            0x7fffffffe500   0x7fffffffe500
r14            0x0  0x0
r15            0x0  0x0
rip            0x40052a 0x40052a <main+4>
eflags         0x246    [ PF ZF IF ]
cs             0x33 0x33
ss             0x2b 0x2b
ds             0x0  0x0
es             0x0  0x0
fs             0x0  0x0
gs             0x0  0x0
Dump the stack
    (gdb) x/20x $sp
    0x7fffffffe420: 0x00400540  0x00000000  0xf7a2e830  0x00007fff
    0x7fffffffe430: 0x00000000  0x00000000  0xffffe508  0x00007fff
    0x7fffffffe440: 0xf7ffcca0  0x00000001  0x00400526  0x00000000
    0x7fffffffe450: 0x00000000  0x00000000  0xbbbdddd1  0xdfdea768
    0x7fffffffe460: 0x00400430  0x00000000  0xffffe500  0x00007fff
Show the instructions
(gdb)  list
1   #include <stdio.h>
2
3   int main(){
4     printf("hello world\n");
5     return 0;
6   }
7
8

(gdb) x/4i $pc
    => 0x40052a <main+4>:   mov    edi,0x4005c4
       0x40052f <main+9>:   call   0x400400 <puts@plt>
       0x400534 <main+14>:  mov    eax,0x0
       0x400539 <main+19>:  pop    rbp
And so on ...
please have a look to gef it is incredibly useful and continuously improved. Here some notes from the main github page:
- Entirely OS Agnostic, NO dependencies: GEF is battery-included and is installable in 2 seconds (unlike PwnDBG).
- Fast limiting the number of dependencies and optimizing code to make the commands as fast as possible (unlike PwnDBG).
- Provides more than 50 commands to drastically change your experience in GDB.
- Easily extendable to create other commands by providing more comprehensible layout to GDB Python API.
- Works consistently on both Python2 and Python3.
- Built around an architecture abstraction layer, so all commands work in any GDB-supported architecture such as x86-32/64, ARMv5/6/7, AARCH64, SPARC, MIPS, PowerPC, etc. (unlike PEDA)
- Suited for real-life apps debugging, exploit development, just as much as CTF (unlike PEDA or PwnDBG)
Installation
wget -q -O- https://github.com/hugsy/gef/raw/master/gef.sh | sh
-
1Link only answers are not ideal, please expand your answer to include relevant details such as what features are offered. Commented Jul 31, 2017 at 12:23
