Learning the GDB commands is on my bucket-list, but in the meantime is there a graphical debugger for *nix platforms that accepts Windbg commands, and has similar functionality? For example, the ability to bring out multiple editable memory windows, automatically disassemble around an area while stepping, set disassembly flavor, and have a window with registers that have editable values?
20 Answers
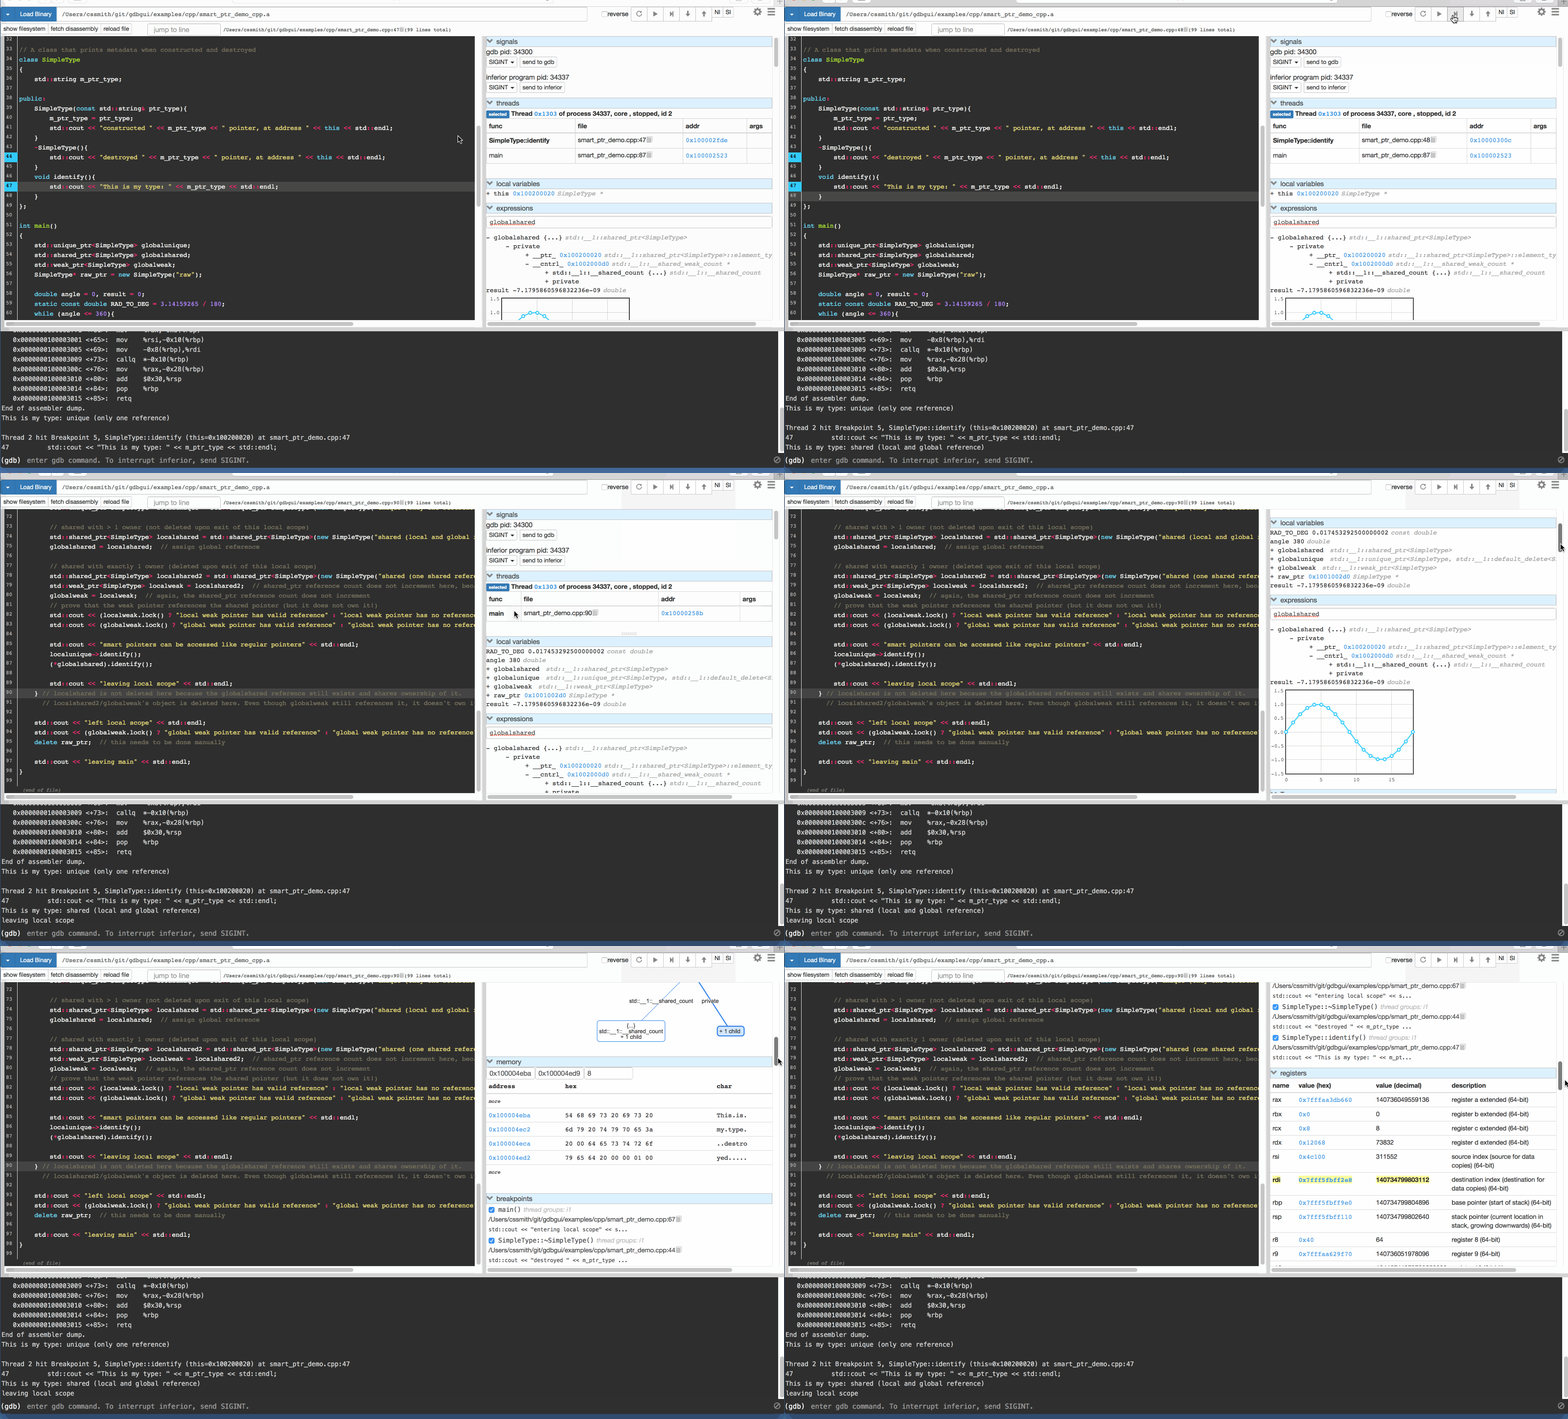
I started my own gdb frontend called gdbgui which is a server (in python) that lets you access a full-featured frontend in your browser.
Install
pip install gdbgui --upgrade
or download at gdbgui.com
Works on all platforms (Linux, macOS, and Windows) and browsers with JavaScript.
Run
Just type
gdbgui
in your terminal, and your browser will open a new tab.
Features
- set/remove breakpoints
- view sourcecode, with optional inline machine code
- select current frame in stack
- step through source code or machine code
- create/explore variables
- view/select threads
- explore memory
- view registers
- full gdb terminal functionality so you can send traditional gdb commands, and view gdb/inferior program output
- layout inspired by the amazing Chrome debugger
- compatible with Mozilla's RR, for reverse debugging
-
1This is some good work, truly. The design gets to the core of the average use-case. I like it. It also supports remote debugging (or, rather, it supports using the
target remote host:portgdb command. Nicely done. Perhaps adding the ability to connect to a remote host in the menu would be a nice add-on. Would it be possible to scale down the 'register` size? All the information is available, but (at least on ARM) you can't see all registers at once, so you have to scroll. Commented Mar 7, 2019 at 11:06 -
6The comments in here are not for individual
gdbguisupport. Please open a new question on sx, or use the gdbgui support channels / bug tracker. Commented Nov 21, 2019 at 21:44 -
Can this report if a binary has all the buffer overflow protections?– ATL_DEVCommented Sep 16, 2021 at 19:34
Although some people don't care for its interface, it's worth mentioning that GDB has its own built-in GUI as well (called TUI).
You can start GDB in GUI mode with the command: gdb -tui
A quick reference to TUI commands may be found here: http://beej.us/guide/bggdb/#qref
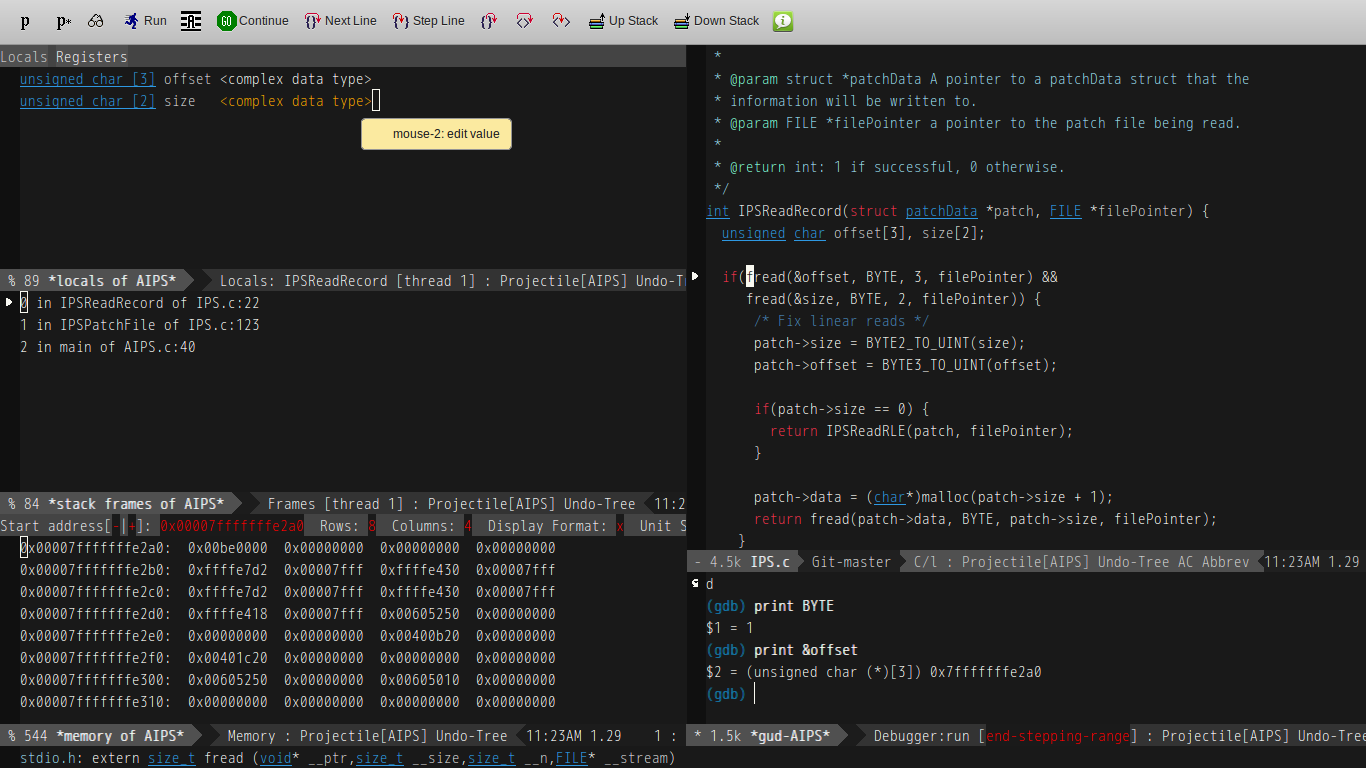
I've generally used Emacs GUD as a GDB frontend.
It isn't too hard to use, allows you to set breakpoints visually (or though the GDB window if you prefer).
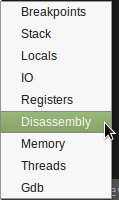
It has multiple different views that you can access from a top-level GDB menu:
It also allows niceties like allowing you to inspect values by mousing over them:
In order to use it, you first need to navigate to the folder of your binary with C-x C-f, then M-x gdb (That's "Alt + X", then typing "gdb"). After doing this, you can type a gdb command line, or just hit [Enter] to accept its default. From there, you just type "start" in the gdb window with any parameters you want to pass to the program you are debugging.
After that, you are pretty much golden, but with only one view. The menus along the top of the screen under "GUD" will let you open other relevant views for whatever you are trying to debug. (Frames are separate windows, and "Windows" are in-frame windows)
Usually by default, a breakpoint is set on program start, and you can then either navigate your code using the buttons at the top of the window or if you have no code, you can customize your view to let you step through a disassembly of the binary you are looking at.
The buttons along the top of the window surrounded with "{}" are for code-level stepping, and the buttons with "<>" in their icon are for instruction-level debugging. So you will probably want to focus on the left if you are doing normal code debugging and focus more on the right if you are getting into the real nitty-gritty.
Also, if you ever get lost, this icon:
It is an entire book that can likely answer your questions. The only time it won't exist in Emacs is if you are on Debian (Ubuntu is fine) and installed Emacs from its repos. In this case you will need to install "emacs<version>-common-non-dfsg" to get the manuals. (With "<version>" being the non-decimal digits returned by M-x version in Emacs)
-
cant enable any panes to show locals or breakpoints using gud. What am is missing? Noting in the gud menu to suggest this is possible. the -mi interface shows them.– RichieHHCommented Mar 11, 2021 at 23:51
-
1@RichieHH oh! Those should be in Gud -> GDB-Windows in your menu-bar (If you don't have a menu-bar, F10 can get you into that) Commented Mar 12, 2021 at 18:47
My opinion is a bit biased but, for debugging assembler, the best GDB 'frontend' out there is IDA (it supports communication with remote GDB targets). For source code debugging, though, I would recommend KDBG.
-
5I would actually recommend using IDA's
linux_serverover remote GDB, it's more capable and faster (since it uses binary protocol and not text-based one).– Igor Skochinsky ♦Commented Apr 2, 2013 at 4:11 -
6Please justify your recommendation. The answers are written not just for the OP but for all the other people who may come across this in the future.– asheeshrCommented May 9, 2013 at 1:53
-
Basically because you have all the power of IDA (plugins, IDAPython scripting, known GUI, ...) and is not only a frontend for GDB. Commented May 10, 2013 at 6:37
Even at the risk of severe downvoting, I'd like to side with the plain old gdb prompt and recommend against a GUI frontend. I started out learning more advanced use of GDB by reading Art of Debugging some years ago. It describes GDB and DDD as well as Eclipse as frontends to GDB. I still recommend the book even in 2023 to learn the basics; despite its age. Of course there is also the GDB manual.
Admittedly most of the time I am using Vim as my IDE on the terminal and tmux (earlier screen with byobu). Therefore I am switching between panes in my terminal multiplexer to switch quickly between code and debugger. The GDB prompt - after some weeks of trying the TUI (start with gdb -tui, gdbtui or at the prompt layout next) - has indeed everything I ever desired and you should keep in mind that you can attach multiple times to the same process (thereby having a look at memory the way you describe it).
It seems that all frontends are lagging behind a little - no surprise - and it makes more sense to come to terms with the GDB prompt and its niceties and oddities. Keep in mind that on a bare-metal setup it may be the only thing you have. Thus it makes sense to learn it even if you find a "decent" GUI by your own standards.
Newer versions of GDB will also support Python scripting and through that provide a very powerful set of tools to debug, even just from the command line.
If you absolutely insist on using a GUI frontend, I would also recommend IDA Pro for the simple reason that it gives you a single frontend for a variety of debuggers and you have to learn (or customize) its shortcuts only once. Disadvantages: price and flexibility when you don't have a license on a particular machine or no way to tunnel to a GDB server etc ...
Additional options to make your debugging experience slicker would be:
- gef: GDB Enhanced Features as recommended in this answer, which is particularly conducive to reverse engineering endeavours
- GDB dashboard
I'm not aware of any frontend of GDB that accepts WinDbg commands. And I can only emphasize again: you will reap the fruit of the time invested in learning vanilla GDB anyway. Don't shy away from the effort. There are plenty of things in WinDbg which are specific to the way Windows works, the Windows kernel works and so on. GDB is much more generic.
I'd like to suggest DDD.
If you've got source code, you should check out QTCreator. Its debugger is similar to Visual Studio's, if you're familiar with that.
-
2I've used
DDDand wasn't a fan. I'll check out QtCreator though, thanks!– mrduclawCommented Mar 30, 2013 at 2:41 -
DDD is great for displaying data structures, you can lay them out on a board (a light table of sorts). Hence data-display-debugger. Commented Aug 2, 2016 at 7:00
-
DDD looks weird and out-of-date at first glance, but it's really powerful. Commented Dec 13, 2018 at 9:19
-
Ddd is, imo, poor and pretty much abandoned. It's certainly not in anyway powerful as all it is is a front end to gdb.– RichieHHCommented Feb 27, 2021 at 23:41
Not GUI but a good replacement once you get used to it (and personally I think it's faster for most stuff) -> https://github.com/gdbinit/Gdbinit.
I remembered when I started *nix reversing and I had to face gdb for the first time. Hated it and +mammon original's gdbinit saved my day. These days I prefer gdb to most GUI debuggers.
Give it a try :-)
Full disclosure: I am the author of the tool.
-
6You should write a disclosure that Gdbinit is a software you're maintaining... Commented Apr 2, 2013 at 13:00
-
6So? It's free, available to anyone. Not exactly trying to sell anything here. Geez...!– fG-Commented Apr 3, 2013 at 3:24
-
6@fg- That still might be some advertising that is not based on experience but solely on the fact you wrote that tool. Commented Apr 6, 2013 at 20:17
-
2So you can't advertise your useful tools that solve problems and have to wait for others to do it? That's some really weird thinking mode for a problem solver "community".– fG-Commented Apr 8, 2013 at 9:59
-
12@fG- please read the FAQ: reverseengineering.stackexchange.com/help/behavior (section "Avoid overt self-promotion") Commented Apr 11, 2013 at 12:28
I don't really like DDD, it's so 90's in it's GUI.
I would like to recommend KDBG, which is a KDE frontend to gdb. Besides, you might want to take a look at Cgdb, which is a curses extension for gdb.
Lately I came across Nemiver, it looks really promising.
-
Does KDBG work well for disassembling and debugging without source as well? Their screenshots showed source code only.– mrduclawCommented Mar 30, 2013 at 17:25
-
-
-
cgdb is also a great option if you use Vim.
cgdb shares a lot of commands with vim, such as regex search and many others. From the cgdb home page:
The keyboard interface is modeled after vim, so vim users should feel at home using cgdb.
I usually use Vim + gdb in CLI mode when coding etc. But sometimes a GUI is preferable.
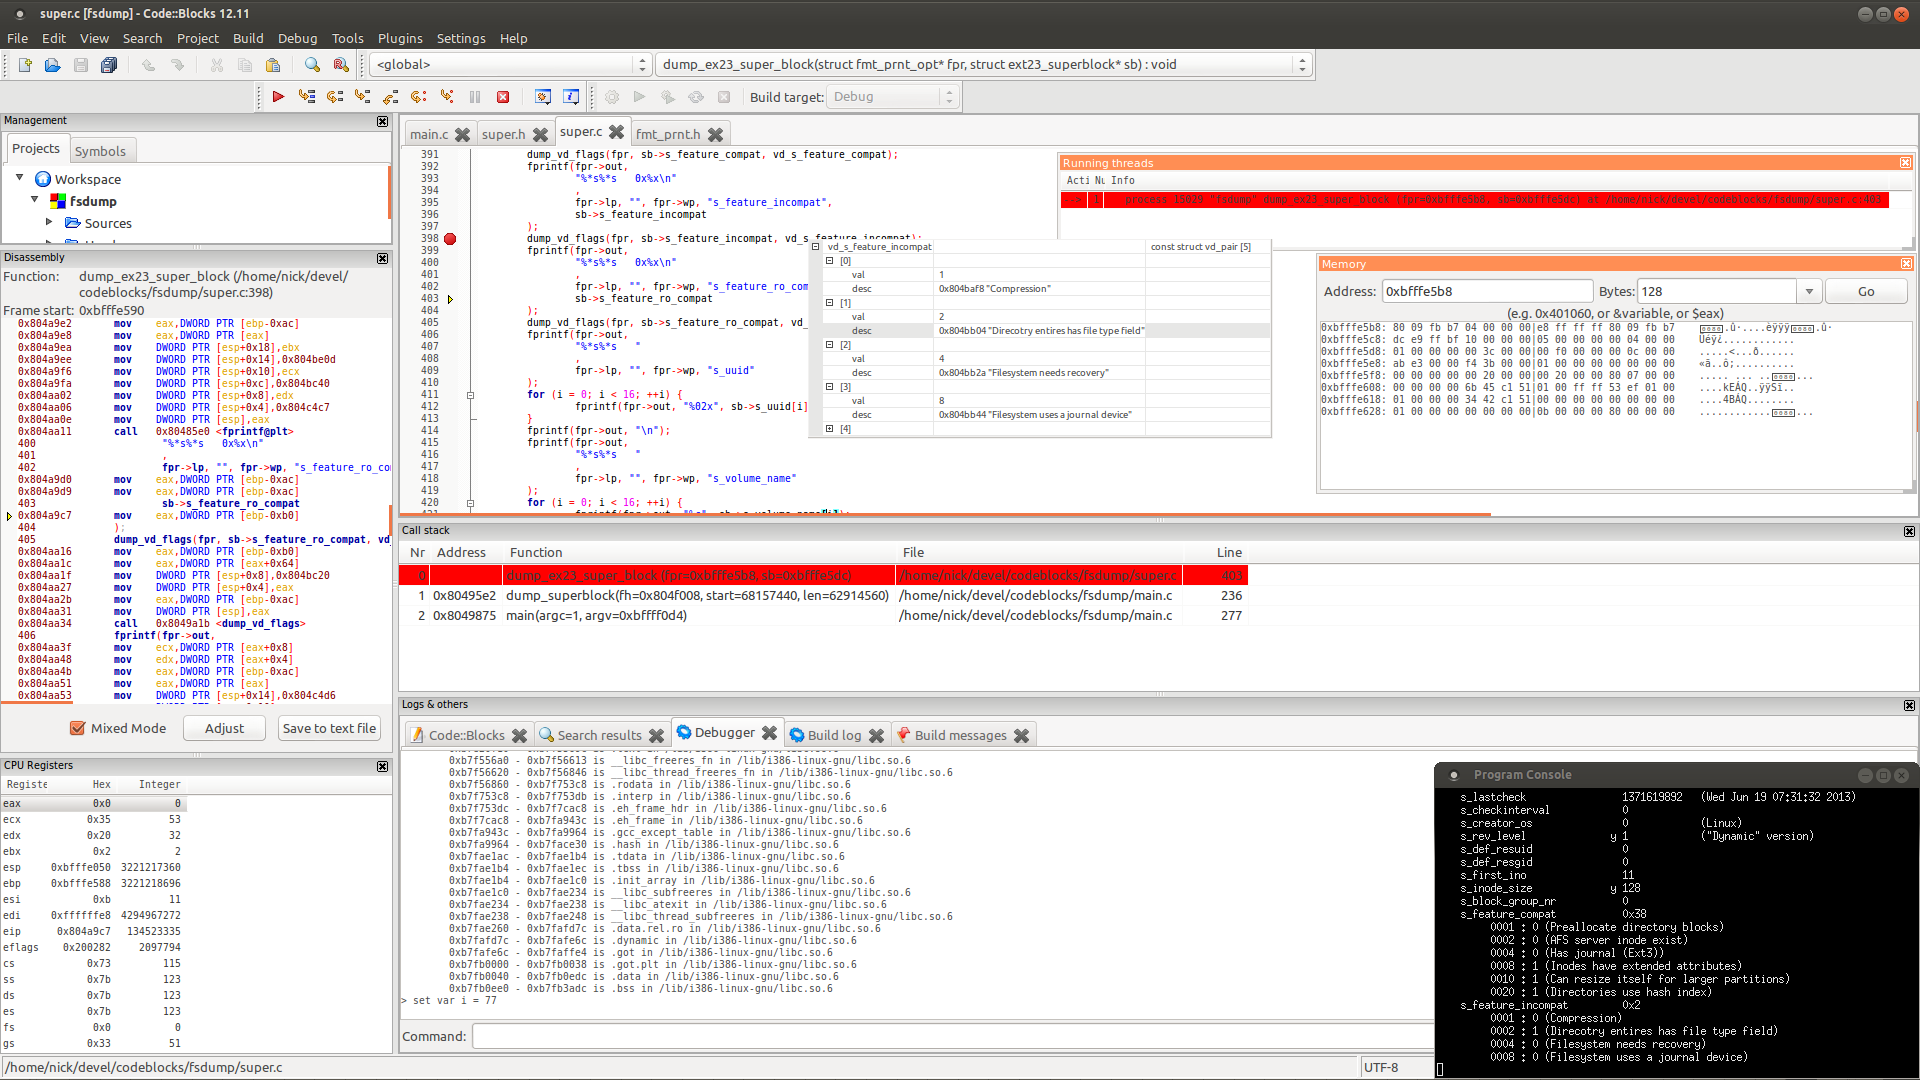
One other option, beside the ones mentioned, is Code::Blocks. It uses GDB and CDB as back-end. For GDB you can select AT&T, Intel or custom for disassembly. It supports mixed mode as well as pure instructions listing. You can further set it up to evaluate variables (in code) under cursor etc.
There is only one memory dump window, but you can additionally enter raw GDB commands in Command line at bottom which gets printed to window – thus e.g. memory dumps.
It has a separate window for CPU registers, they are not directly editable, but you can set values by mentioned command line, as well as other values:
set $eax = 123
set var xyz = 'q'
Picture below shows it in action with source debugging on a KVM (Open link to view it in larger format).
One issue I have had with it is some GUI bugs etc. when I run it on Ubuntu 12 – UB 12 have version 10.10. But a compile and install of current release, 12.11, was painless.
E.g. for custom install path install (If your distribution does not have up to date version and you want to have both):
- Download (SVN or release).
- Unpack.
- ./configure --exec-prefix=/blahblah/codeblocks --prefix=/blahblah/codeblocks
- make
- sudo make install 2>&1 | tee my_install.log
VisualStudio.Code (VS.Code) runs on Linux and has a "Native Debug" extension that lets you use gdb. It has very responsive UI. It's extremely light on resources. The experience somewhat approximates Visual Studio on Windows for C++ developers (there's no assembly view though). The main debug shortcuts are the same out of the box (F5, Shift-F5, F10, F11).
Installation is two-click (one to install VS.Code, the other to install the extension), great for someone coming from Windows Visual Studio and looking to be productive right away.
This Dr Dobbs article shows in detail GUIs for debugging on Linux OS. I recommend the Qt-Creator called GDB debug based on Linux environment. Anyway the article only reviews debugging C++ code, but that is enough to show off GDBs debugging features.
There's Voltron, which is an extensible Python debugger UI that supports LLDB, GDB, VDB, and WinDbg/CDB (via PyKD) and runs on macOS, Linux and Windows. For the first three it supports x86, x86_64, and arm with even arm64 support for lldb while adding even powerpc support for gdb.
The author also wrote a Binary Ninja plugin to integrate Voltron -- https://github.com/snare/binjatron -- which allows syncronized views.
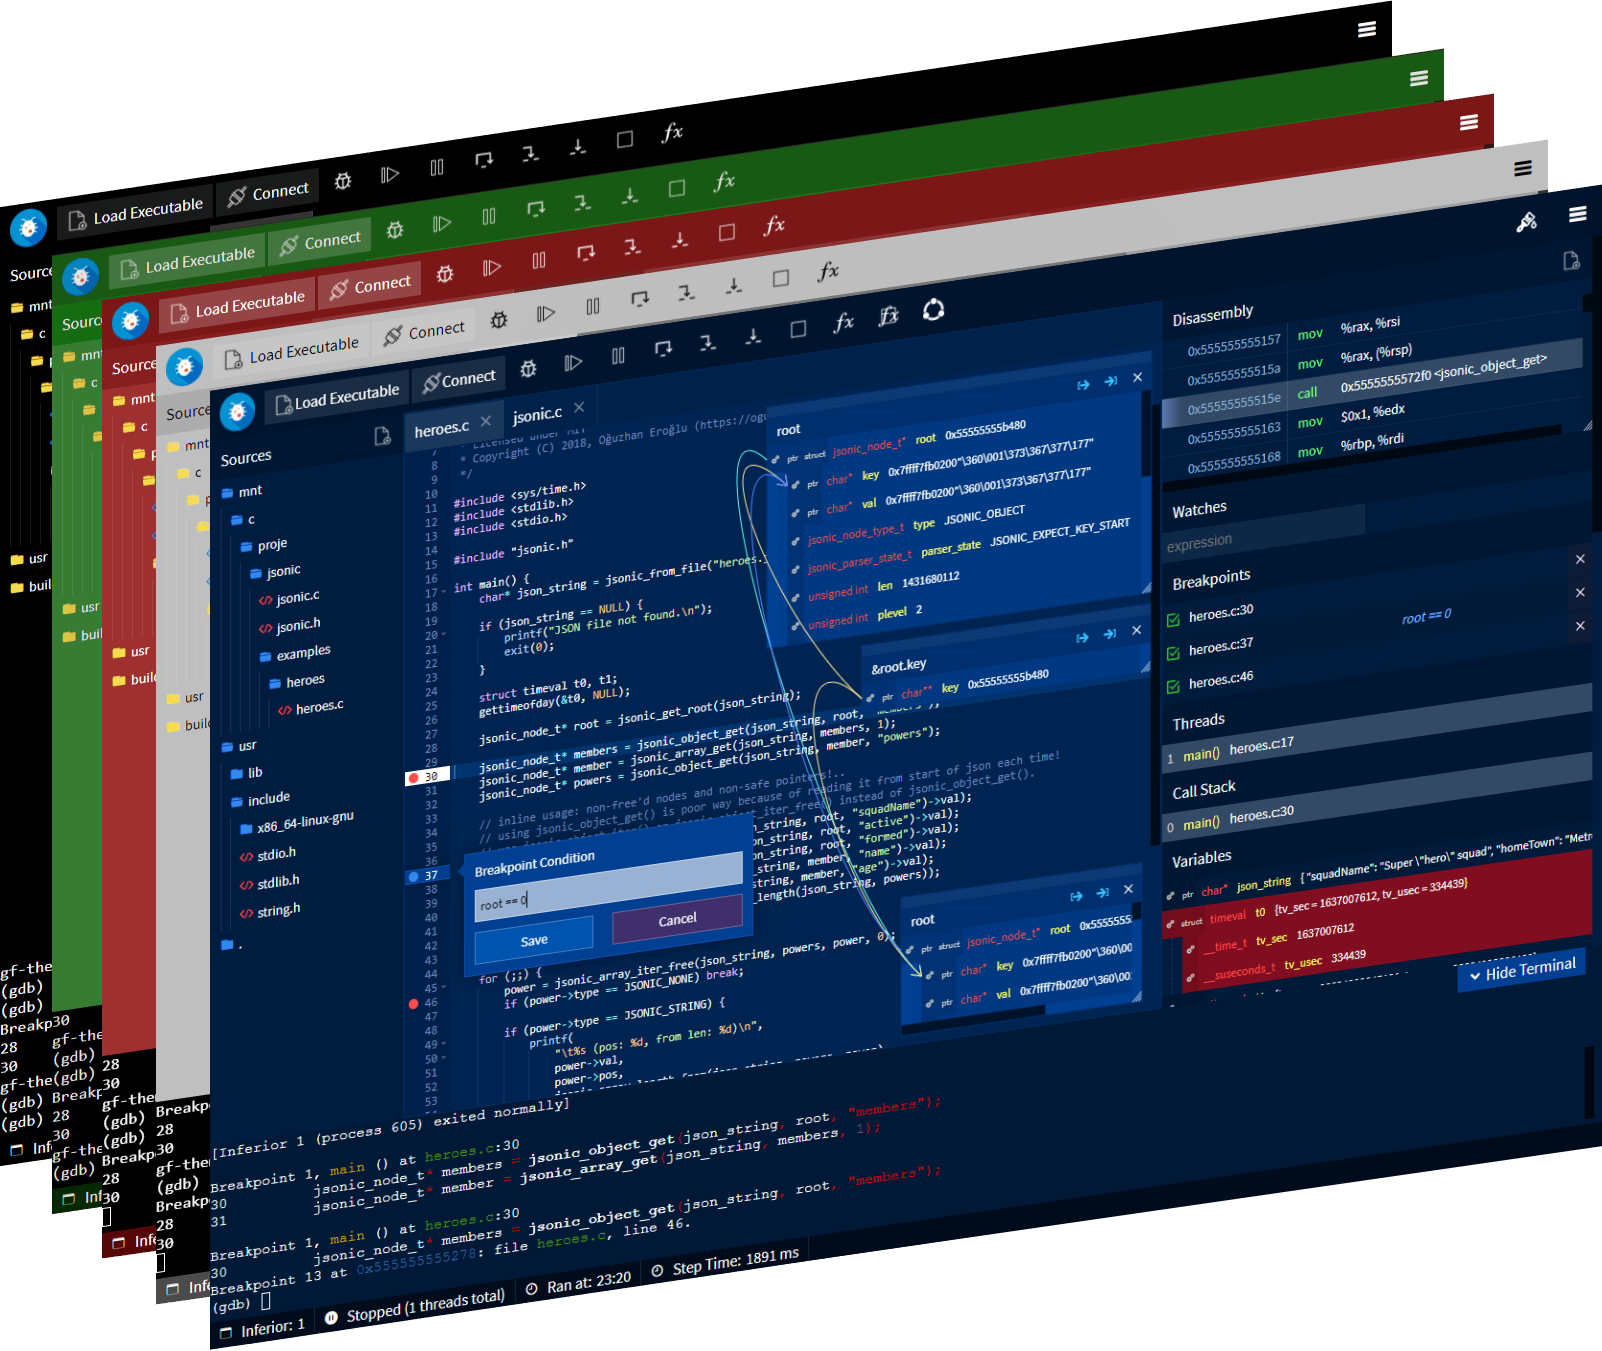
You can use GDBFrontend that I develop for a while.
-
It's rather nice. I liked it but ended up moving back to gef.– RichieHHCommented Feb 27, 2021 at 23:43
I will recommend UltraGDB, which is GDB GUI frontend and lightweight IDE based on Eclipse technology.
There iswas Affnic Debugger GUI. It is not free but a lite version exists. It's available for Windows, Linux & MacOS.
From the official website,
Affinic Debugger GUI .aka. ADG, is designed as a graphical user interface for various debuggers. This build is specifically targeted on GDB, the GNU debugger. With the graphical windows, ADG can unleash the full power of debuggers by viewing multiple types of information within one view and maneuvering debuggers with easily clicking. ADG also provides an integrated command terminal for users to input debugger command directly. ADG is available on Linux/Windows/Mac OS X.
Frankly speaking... Nothing can really compare to the GDB itself. Just take the newest version, start it with gdb-multiarch (GDB now has support for all architectures and you don't need any kind of GDB branch anymore).
When GDB runs just load a file:
file <some_file_with_gdb_symbols.elf>
and connect to a running GDB server (on port :3333) - in my case Openocd that communicates with any kind of embedded board:
target extended-remote :3333
When the session starts type these commands taken directly from the newest GDB manual (link, section 25):
tui enable
tui new-layout mylayout {-horizontal {src 8 asm 2} 6 regs 4} 8 status 0 cmd 2
layout mylayout
refresh
set tui border-kind space
set tui tab-width 4
set tui compact-source on
with pagination off -- focus cmd
Put these commands in a system wide GDB configuration file
/etc/gdb/gdbinitand live happily ever after.
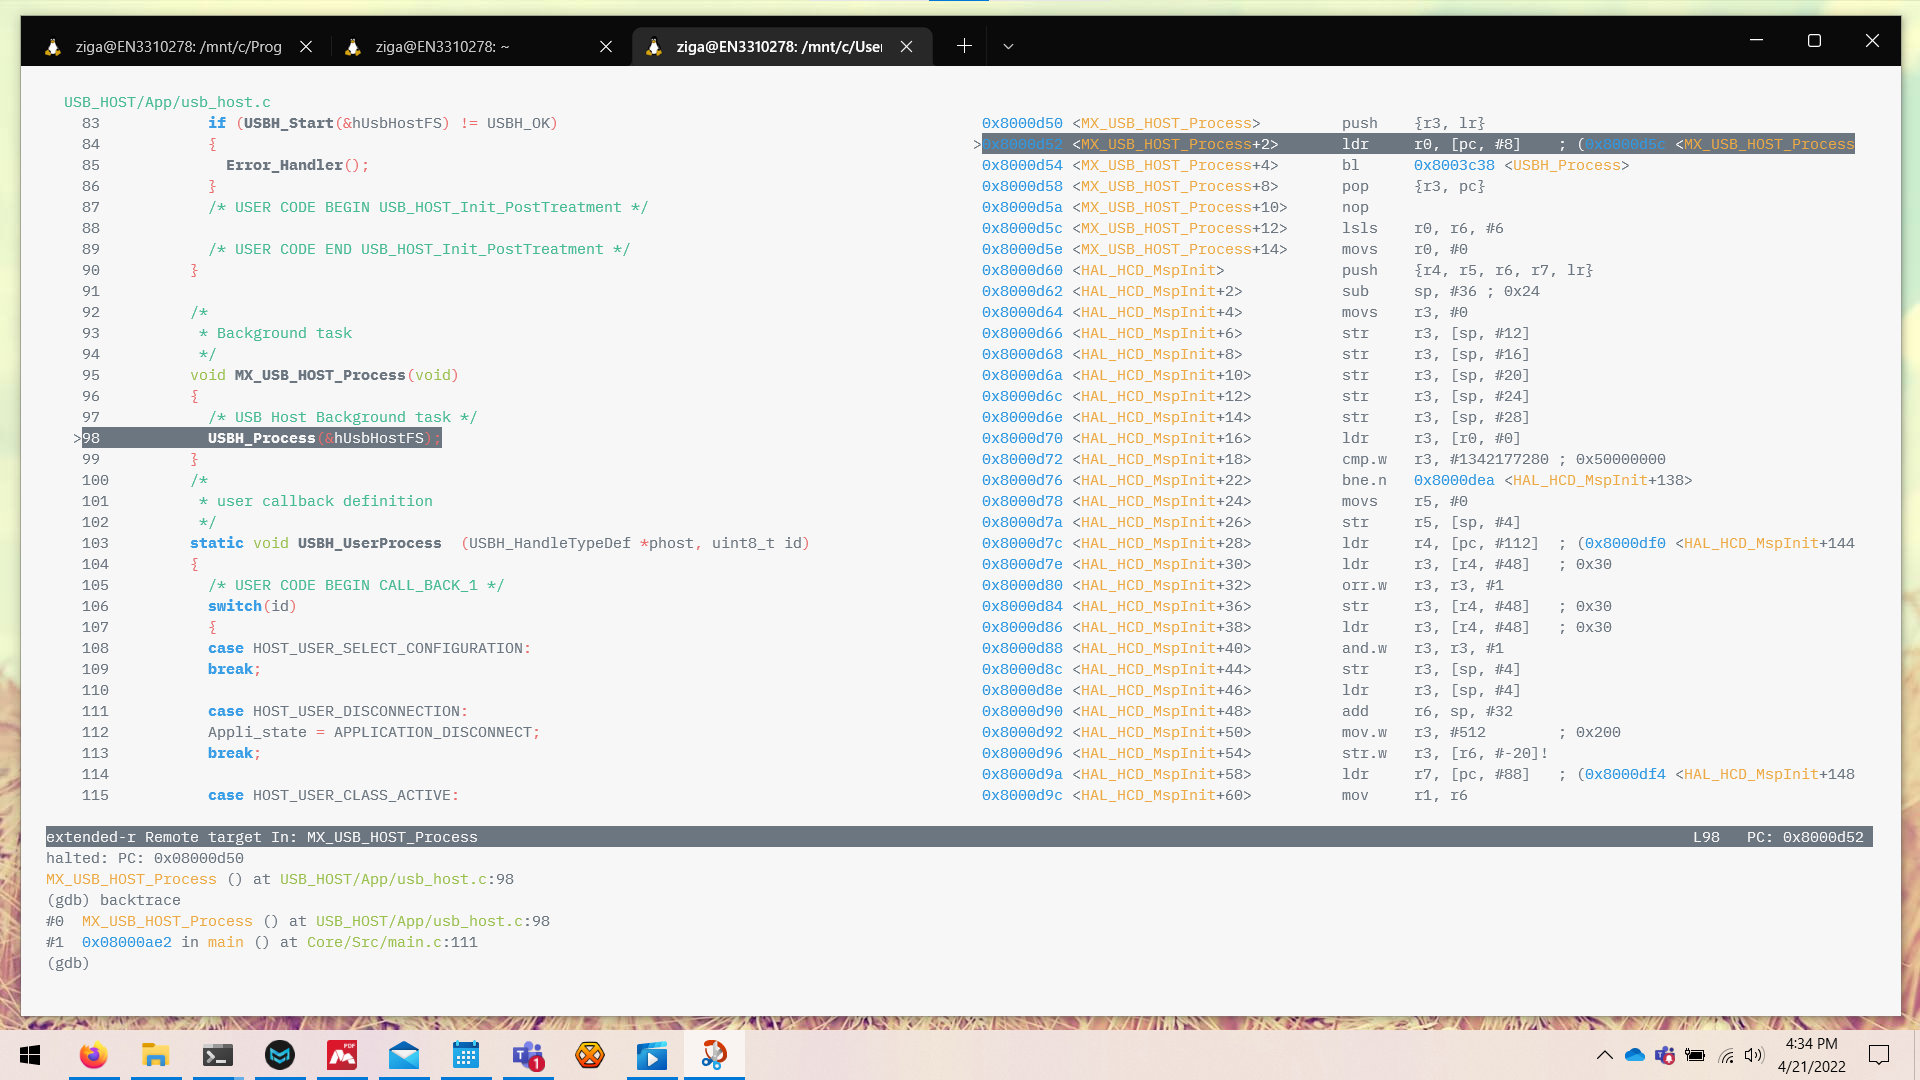
After all is done you should end up with something like this:
Extremely pleasing if you ask me. Especially with the newest GDB that now can stack windows horizontally (excluding cmd & status where cmd can only be full width... oh why such limitations...) as can be seen from the command where I created my layout i.e. mylayout.
All that I am missing is a window for monitoring variables, addresses or expressions which I would love to position on the right of asm window... GNU, I know you can do it!
Fast, self contained, documented and supported is the wonderful gef (GDB Enhanced Features)
I've written a new frontend called Seer. Give it a try and offer and suggestions.
