1

I'm just learning Olly/IDA and writing simple programs in C and looking at the .EXE code in Ollydbg and IDA. Below I have a simple printf Hello World program which I compile in Visual Studio 6. I can see the chain of events starting with things like kernel32.dll calls to get the Windows version number, set up the heap, get the command line, etc. I recognize the main() function and see string variables being put on the stack and can deduce the function at 00401010 is printf(), confirmed by IDA if I look at the "Names Window" for that address, but Olly doesn't explicitly tell me.

#include <stdio.h>

void main(void)
{
printf("blah blah\n");

return;
}

And in Olly here is the assembly for my main() function:

CPU Disasm
Address   Hex dump          Command                                  Comments
00401000  /$  68 30604000   PUSH OFFSET 00406030  ; ASCII "blah blah"
00401005  |.  E8 06000000   CALL 00401010
0040100A  |.  59            POP ECX
0040100B  \.  C3            RETN

So those assembly instructions above is all that correspond to the C code I wrote. The rest of the .EXE is filled with lots of other code that I'd like to be able to recognized and distinguish the application from LIBC functions like printf(). I know that the compiler will generate OS dependent setup and teardown stuff (like the windows version #, heap, etc), but I figure that after a few programs and learning the PE program standard I should be able to recognize that (plus Olly takes you past that to the application code anyways).

Here, for example, is what I believe to be the top function for the LIBC printf() function, called by CALL 00401010:

CPU Disasm
Address   Hex dump          Command                                  Comments
00401010  /$  53            PUSH EBX
00401011  |.  56            PUSH ESI
00401012  |.  BE 70604000   MOV ESI,OFFSET 00406070
00401017  |.  57            PUSH EDI
00401018  |.  56            PUSH ESI
00401019  |.  E8 4B010000   CALL 00401169
0040101E  |.  8BF8          MOV EDI,EAX
00401020  |.  8D4424 18     LEA EAX,[ARG.2]
00401024  |.  50            PUSH EAX
00401025  |.  FF7424 18     PUSH DWORD PTR SS:[ARG.1]
00401029  |.  56            PUSH ESI
0040102A  |.  E8 04020000   CALL 00401233
0040102F  |.  56            PUSH ESI
00401030  |.  57            PUSH EDI
00401031  |.  8BD8          MOV EBX,EAX
00401033  |.  E8 BE010000   CALL 004011F6
00401038  |.  83C4 18       ADD ESP,18
0040103B  |.  8BC3          MOV EAX,EBX
0040103D  |.  5F            POP EDI
0040103E  |.  5E            POP ESI
0040103F  |.  5B            POP EBX
00401040  \.  C3            RETN

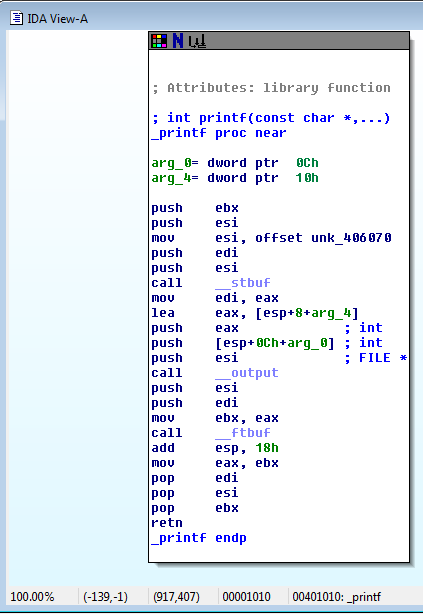
If I open my EXE in IDA and look in the "Names Window" I see this code starting at 00401010 as "_printf", if I double-click on it I see the following:

IDA view of first level of _printf

That is just the top level, if I follow it down a few levels (following CALL instructions to deeper functions) far enough I find OS functions like KERNEL32.WriteFile() which actually make the string appear in the CMD window.

My question is: how can I recognize library functions like printf() and distinguish them from the application code? It would be nice if they could appear labelled. I know there are scripts and plugins for Olly but so far (in my early learning) I haven't found how to do this.

So far I only know to take the same EXE into IDA and look at the address in the "Names Window" to see if it's the first level function of a CLIB function. But then it would take some work to label functions called by this function as also being part of the standard C library, and not the user code.

It's not a big deal looking up the address in IDA, but there's still a huge amount of code that is lower level functions that it would be nice if I could know quickly are part of CLIB and not the application code.

I'm going to guess it's something like building up an Ollydbg .UDD file or downloading a plugin or script. Sorry if it's obvious in some docs but so far I haven't found it.

All that said, I can imagine that the linker may change things such that the exact pattern may not exist in memory each time, if some optimization is done.
2 Answers 2

1

Instruction apply to both ollydbg 1.10 and ollydbg 2.01 unless otherwise noted

select the module of interest viz helloworld.exe using alt + E right click with selected module and enter (view code in cpu) and let ollydbg analyze the module using ctrl + A

then use ctrl+g goto

type [modname].main without the SQ brackets in the edit box / list box
ollydbg 2.01 select from the drop down list and follow expression
ollydbg 1.10 hit ok

you will be on the main function
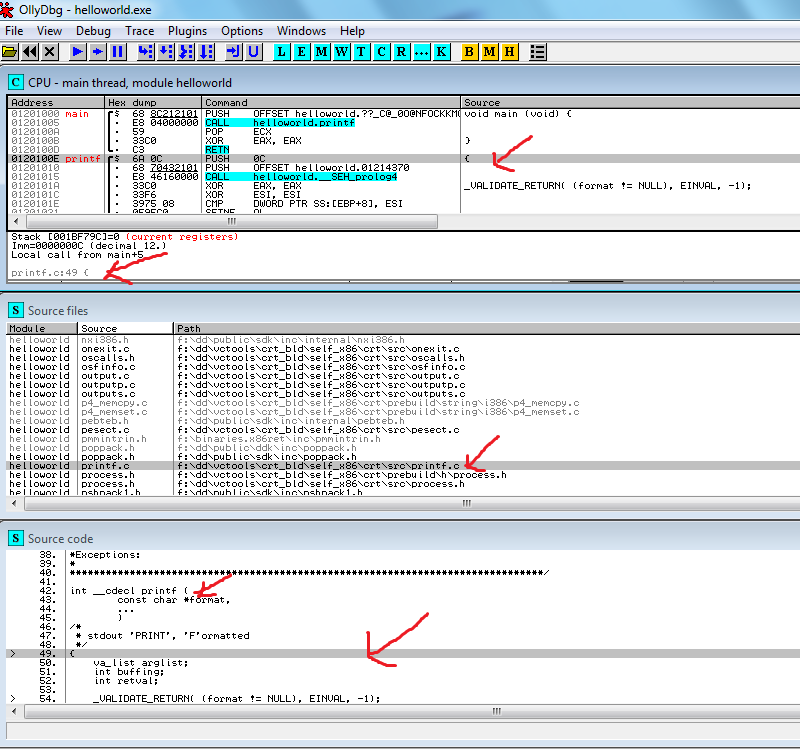
and ollydbg will show your main correctly annotated
enter image description here

further fine tuning can also be done

the comments pane can be cycled through comments and source
right click->appearance->show bar .
click on the bar to cycle through source , comments , profile
if you have built your executable with debug info in ollydbg will show the correct source line with respect to disassembly

you can also setup the display of disasm using
ctrl+o
and check marking appropriate boxes that correspond to
Show Symbolic names , Show Module Names , etc
(explore and decide for your self what suits you)

as to understanding the crt function that lead to your actual code install some version of visual studio and look at the actual sources in crt folder and setup the src folder directory structure for ollydbg to pull them up and show it side by side in the comments pane

I am not sure what you mean ollydbg does not recognize functions like ida though Ida has flair (pre collated information in the form of signatures to standard code ) ollydbg does a decent job in annotating functions

since you say you compiled it have you enabled debug information to be generated while compiling (/Zi switch if you compile it visual c++ compilers from microsoft ) look for similar switches if you compiled it from other compilers

if you compiled it with visual studio then you should have a copy of crt function in the folder (c:\progxxx\micvis\xxx\crt)

the original location for these src files for visual studio 2010 express is f:\dd ( if you dont have a partition named f use mount , if you have a drivepath f occupied by other devices like cdrom use diskmgmt.msc to change the drive letter put a removable disk use dismgmt.msc to change the drive letter to F: for that removable disk and copy paste the sources to that drive ollydbg will automatically pull it

the udl feature is not for import libraries.
import library does not contain the object data

header files are text file and they are equally of no use while doing binary analysis

lat but not least there are several plugins that can import the ida signatures into ollydbg one such is idasig / or godup plugin look at tuts4you.com you might find hundreds of plugins for ollydbg in ida produce -> map file and import the map file using these plugins

have you setup options -> code -. check marks pertaining to show local , show symbolic address etc

a screen shot of ollydbg showing the source for printf function enter image description here

3
  • Thanks, that helped with adding labels. I can add labels with ':', and see CALL instructions use that lable name, and then go to them with ctrl-G as you said. I'm still trying to get Olly to recognize the functions as IDA does, I don't have the source file for LIBC.LIB which the compiler linked with. I tried dragging and dropping in STDIO.H and LIBC.LIB but Olly just shows them as binary files. I do see Debug->"Create Function Library" and mention of "Stardard Function Libraries" (.UDL files) in the options->Directories tab. So I'' try see how to create or import those.
    – Markbotix
    Commented Jan 28, 2016 at 23:02
  • i added more info take a look
    – blabb
    Commented Jan 29, 2016 at 5:08
  • Thanks Blabb, I now know how to see at least my own source code along with the assembly in Olly, just simply bringing the .PDB file along with the .EXE. I now have the C source code line appearing. For VS6 I had to change a couple settings to get .PDB files to be created for release link. And since I had VS6 in a VM, I had to reproduce the directory path and put the source code there, I guess .PDB files have absolute file paths. So next to follow your advice to get the CRT or CLIB library source code in there as you did.
    – Markbotix
    Commented Jan 29, 2016 at 9:03
0

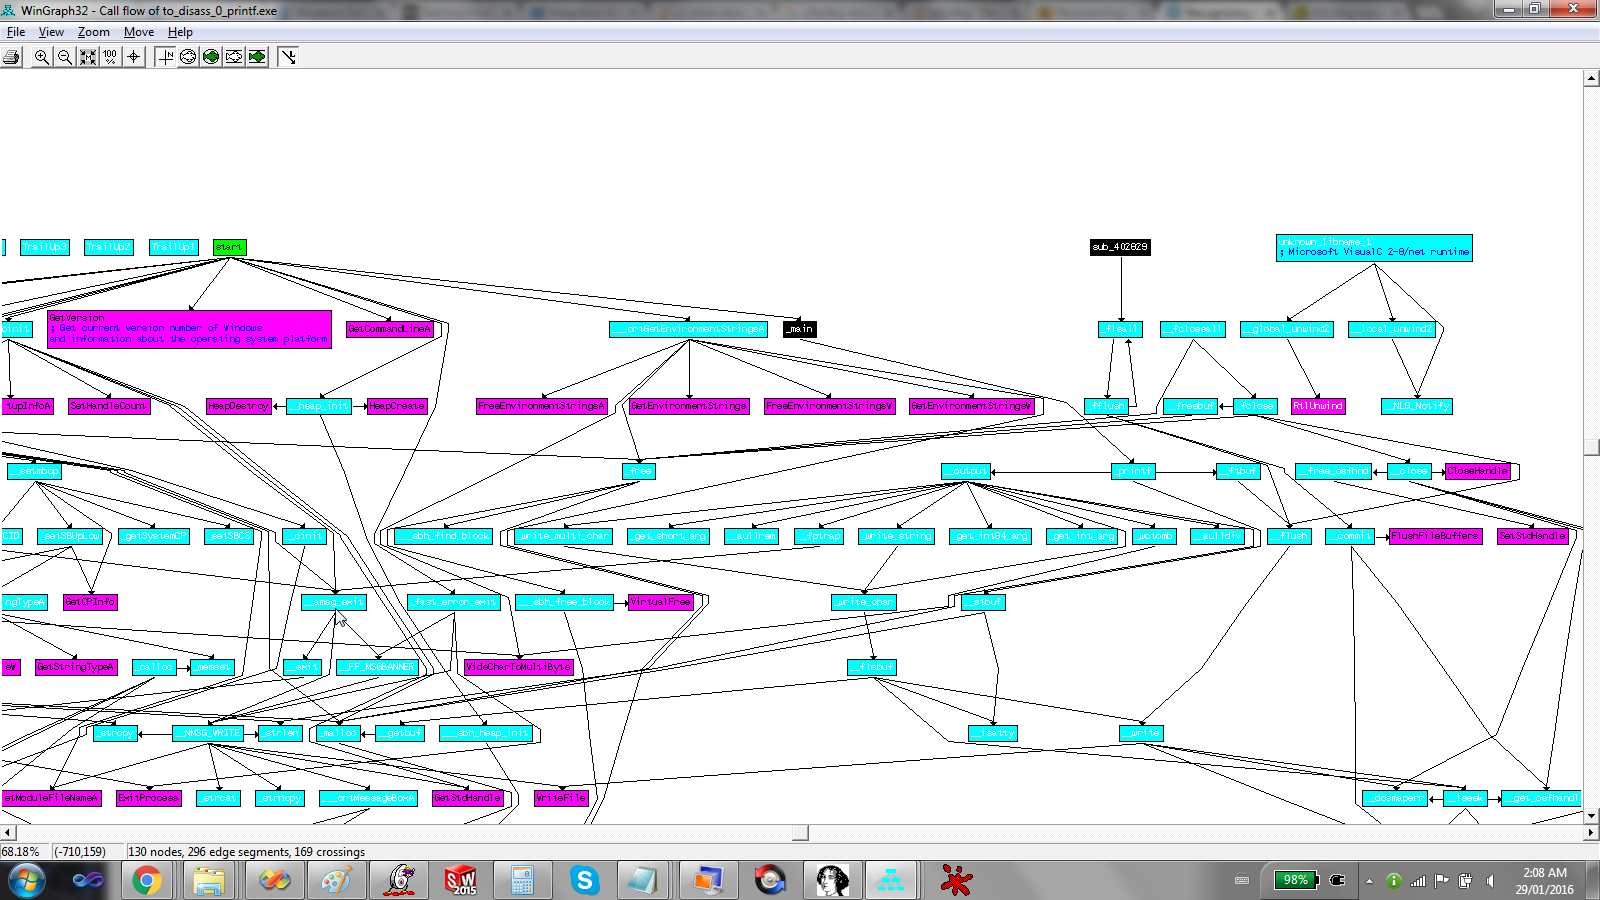
Slightly different than what I wanted (recognize LIBC/CRT in Olly) is to look at the graph in IDA. At first it seemed daunting with all the functions shown (see frightening picture below, my main() is the black box labelled '_main'). Note my program is a single call to printf().

enter image description here

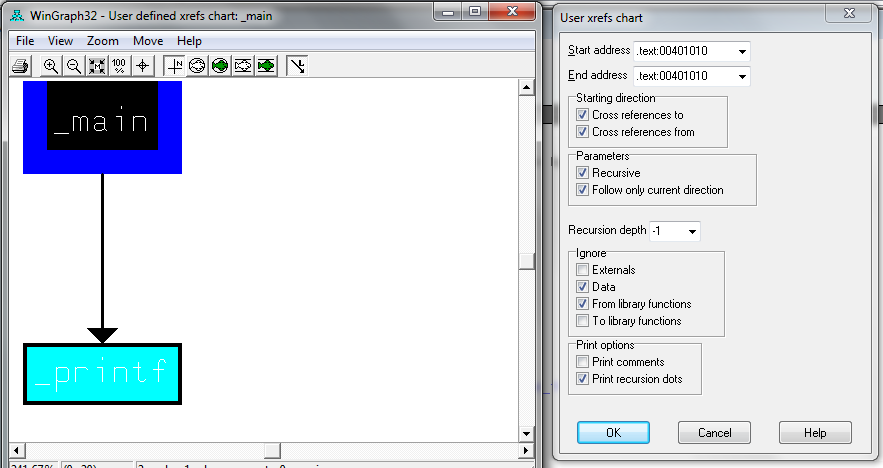
Then after reading IDA's tutorial link I see I can use the enter image description here button "display graph of xrefs specified by user" and turning on the checkbox "From Library Functions" under "Ignore" then it draws a much simpler tree:

enter image description here

So I can see now how to easily distinguish application code from the C lib and startup functions, at least in IDA.

For Ollydbg, Blabb's answer shows how to do it with PDB files, now I want to try to do it without debug or a .PDB file.

Your Answer

By clicking “Post Your Answer”, you agree to our terms of service and acknowledge you have read our privacy policy.

Not the answer you're looking for? Browse other questions tagged or ask your own question.