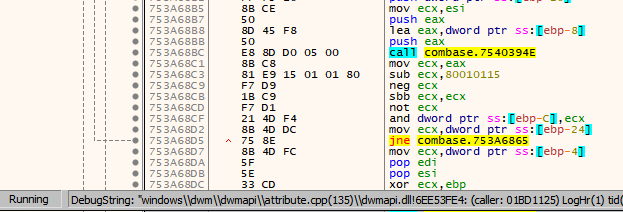
i.e. when the program is running, and x64dbg is attached to the process - how can i see where it is at this moment?

-
1I don't know if I understood correctly but as you haven't marked mrexodia's answer as the correct one I was wondering if you mean on how to set the view to where the current thread execution is. You can do so by double clicking the RIP register.– Michael PittinoCommented Jul 3, 2018 at 17:22
-
@MichaelPittino this question was a while ago, but now i can't understand well, why i've marked that answer. I really want to know where the current application execution/thread is at this moment– T.ToduaCommented Dec 1, 2018 at 10:52
-
1In CPU view right click -> go to -> origin– Gero B.Commented Aug 16, 2020 at 17:57
2 Answers
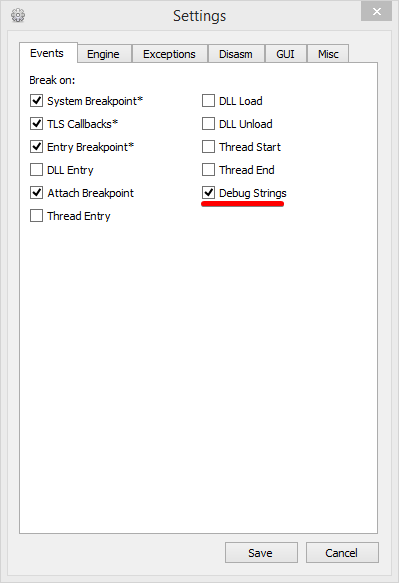
From your screenshot I understand that you want to break on. You can do this by breaking on the debug string event. Use the following setting:

If you want to pause the execution, simply click the “pause” button. If you want to see the current instruction executes you can use the “Threads” tab and double click the EIP/RIP column of one you’re interested in.
-
1
-
1The column with the name RIP or EIP (depending on what architecture you’re debugging)– mrexodiaCommented Nov 18, 2018 at 17:26
-
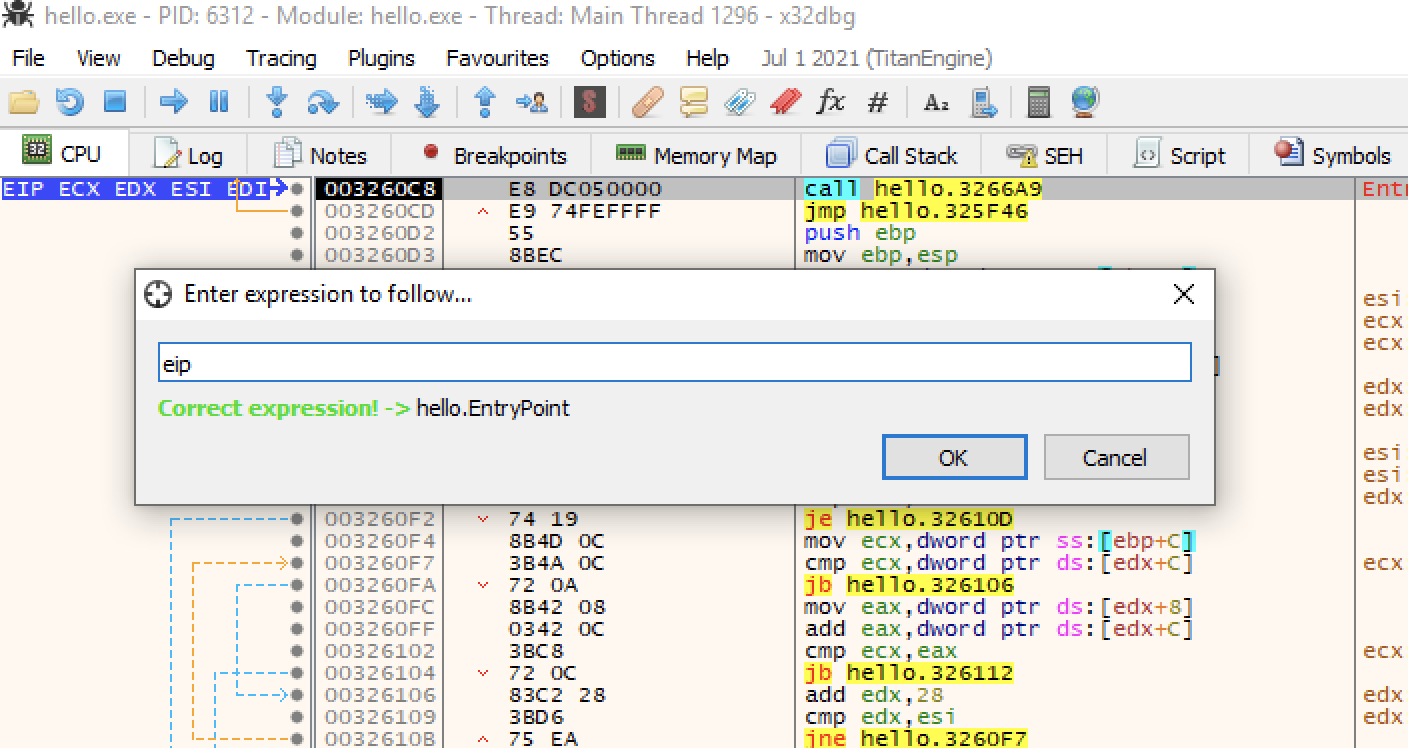
Use the keyboard shortcut Ctrl+G (go to expression) and type eip or rip depending on your architecture.
