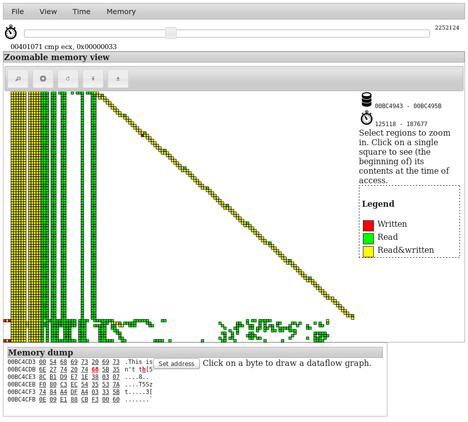
I am quite new to reverse engineering (but have some experience with OllyDbg). What I want to do, is to attach to Windows executable file or library (mostly PE32, but x64 would be a great benefit) and record how it interacts with virtual memory in order to do some self-study and experiments. E.g. I want to have timestamp,operation type(read,write,allocate etc.), address, amount of data transfered records for some period of program's runtime. My first thought was to use breakpoints in OllyDbg, where you can set breakpoint on the memory range and operation type. But this will cause execution to stop every time, so gathering of the data will take a lot of time. Also I need to know memory ranges, but if program will try to write into unallocated memory for some reason - I'll lose this data. Also I found that Intel Pin can do something similar to what I want, but as I understood it can't record the timestamp of memory operation.
So my questions is: Is there any tool that can fit my requests? If not - which tools can be modified in some feasible time? In the worst case I would be satisfied with something that can track amount of read(or write, or allocation - all separately) operations per millisecond (or other significantly small time period).
Thank you.
