Index (shortened)
- Gentle Intro - binary executable code, how does it look?
- Why it is a hard task to compare binary executable code?
- Conclusion
- Solutions
- TL;DR
TL;DWTR (too long, don't want to read): skip ahead to the section Why it is a hard task to compare binary executable code? if you feel comfortable with the basics around assembly and disassembly. Alternatively skip to the bottom of this answer (TL;DR).
Gentle Intro - binary executable code, how does it look?
Binary executable code is made for computers to read, this is why it is commonly referred to as machine code. This means it is binary "data" that is usually represented as hexadecimal numbers to the naked eye. A category of tools named "hex editors" exists for this task.
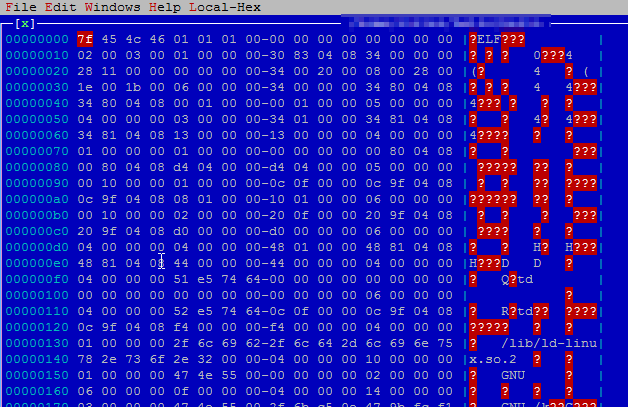
Here's how this commonly looks, using HTE for the screenshot:

The reason this is so convenient is because each hex digit represents exactly one nibble, that is 4 bits. So two hex digits can be used to represent a single 8-bit byte (the most common type of byte). Then showing them in multiples of 16 bytes per line has the additional advantage of making it easier to read the hexadecimal offset (given as 8-digit hexadecimal number in front of the hex bytes in the screenshot above), because decimal 16 is 0x10. The most common notations for hexadecimal numbers are:
- prefix
0x: e.g. 0x10 (C and related languages)
- prefix
$: e.g. $10 (Pascal, Delphi)
- suffix
h: e.g. 10h (assembly language)
Side-note: the line between code and data is a thin one and disassemblers sometimes struggle to identify the bytes in a binary file as one or the other, although heuristics can be applied to help in the process of identification.
Assembly
Aside from the "raw" form of hexadecimal numbers there is also the human-readable representation known as assembly language. This is a mnemonic form of the binary instructions (or opcodes) and usually represents them 1:1 with very minor abstractions. The notable exception to this are macro assemblers such as Microsoft's MASM which provide a higher levels of abstraction as a convenience.
Side-note: the program that digests assembly language code (also "assembly code" or "assembler code") is called an assembler.
Depending on the type of processor and the exact architecture, various flavors of assembly language exist. For the scope of this question we'll stick with the IA-32 architecture - also known as x86 (32bit, x86), because its origins lie with the 8088 and 8086 processors, with subsequent processor (CPU) models being numbered 80x86, where x was a one-digit number. Starting with the 80586 Intel departed from that naming scheme as they introduced the Pentium.
Nevertheless, it is good to know that two main processor architectures exist: CISC (68k, x86, x86-64) and RISC (SPARC, MIPS, PPC), whereas the aficionados of one or the other have claimed victory for their preferred architecture at one time or another, both still exist to this very day, although at the microcode level one could even argue CISC architectures to be RISC "internally". That said, x86 is a CISC architecture.
Just to give you glimpse of what RISC and CISC look like in comparison, let's look at a few basic x86 and MIPS instructions:
 x86          |    MIPS              | Meaning
-----------------------------------------------
 mov          | lb, lw, sb, move     | copy/"move" value from/to register/memory location
 jmp, jz, jnz | j/b, beq, beqz, bgez | jump unconditionally or on condition
 call         | jal                  | call other routine / jump and link
What hopefully becomes clear at first glance (line with mov) is the fact that in MIPS you heave a much larger number of very basic instructions than x86, which is the gist of the CISC versus RISC paradigm. Another thing is that we see how MIPS uses j and b as the mnemonic prefix for jump and branch (the difference being generally the distance these "jumps" can cover), whereas x86 uses also j as in jmp (unconditional jump), jnz (jump if not zero[-flag set]) but also has a dedicated call opcode which MIPS to my knowledge doesn't have - the closest approximation probably being jal (jump and link) which also stores the program counter in a register as opposed to x86's call, though, which stores it on the stack.
In CISC you can do a relatively complex operation with a single instruction, where in RISC you often need several instructions to express the same thing. In fact assemblers for RISC architectures tend to have so-called pseudo-instructions which combine oft-used combinations of instructions, but which get translated to individual RISC instructions during the translation phase.
An example would be the ror (bit-rotate right) instruction. On an x86 (CISC) this is an opcode in its own right with the ror mnemonic. On MIPS (RISC) this is a pseudo-instruction if and when the assembler offers it and it gets translated as follows (bit-rotate the value in register $t2 by one bit and store result in $t2 again):
ror $t2, $t2, 1    -->   sll $1 , $10, 31  (bit-shift $10 left by 31, store in $1)
                         srl $10, $10, 1   (bit-shift $10 right by 1, store in $10)
                         or  $10, $10, $1  (bit-wise or $1 and $10)
This example is taken from the book referenced a bit further down from here (MIPS resources), page 370.
However, we won't dig further into assembly language basics and instead focus on answering the question. I think it is not necessary to understand much more than the most fundamental facts to understand why simple and even complex diff tools fail at showing the differences of binary executable files.
Compilers and assembly language
Compilers (compilers) convert code constructs usually written by humans or machines into machine code [*]. The usual translation is to translate the human-readable source code into an intermediate form which gets then optimized and after optimization translated to assembly language which in turn gets translated to machine code. This is shown beautifully in the Wikipedia article above, with the diagram I am reproducing here below:

The gist is, that compilers usually have an assembler somewhere in their back end, even though you may never get to see the actual assembly language instructions yourself. If you wanted to get it, you would use:
- With GCC:
gcc -S ... (AT&T syntax) or gcc -masm=intel -S ... (Intel syntax)
- With Microsoft Visual C++:
cl.exe /Fa ...
[*] this is not the entire truth, as there are compilers which will create an intermediate byte code which then later gets translated further into machine code native to the CPU it is running on or interpreted on-the-fly. But for the scope of this answer we'll consider compilers to be the entities that convert human-readable high-level language source code into machine code through a number of processing stages, one of which involves assembly code.
NB: some compilers, such as Embarcadero Delphi will hide the different stages from you and present the process from compiling to linking as one opaque step. This can cause some confusion in Delphians attempting to learn C/C++ which expose the different steps.
Intel versus AT&T syntax
For x86 there exist two competing syntax variants. The AT&T syntax is favored in the *nix world and by GASM, Intel in the Windows world and most disassemblers and assemblers. Consider this simple C program:
#include <stdio.h>

int main()
{
    printf("Hello world!\n");
    return 0;
}
... and the translations with the AT&T (gcc -S hello.c or explicitly gcc -masm=att -S hello.c) and Intel (gcc -masm=intel -S hello.c) syntax respectively:
 AT&T                        |  Intel
------------------------------------------------------------------------
.LC0:                        | .LC0:
    .string "Hello world!"   |     .string "Hello world!"
    .text                    |     .text
.globl main                  | .globl main
    .type   main, @function  |     .type   main, @function
main:                        | main:
    pushl   %ebp             |     push    ebp
    movl    %esp, %ebp       |     mov ebp, esp
    andl    $-16, %esp       |     and esp, -16
    subl    $16, %esp        |     sub esp, 16
    movl    $.LC0, (%esp)    |     mov DWORD PTR [esp], OFFSET FLAT:.LC0
    call    puts             |     call    puts
    movl    $0, %eax         |     mov eax, 0
    leave                    |     leave
    ret                      |     ret
You'll notice how the syntax differs. Registers in AT&T syntax are denoted with the %, literal values with $ and the position of source and destination register is the inverse of the Intel syntax. Furthermore some of the mnemonics differ (movl instead of mov). In Intel syntax the size of the operands helps to infer the intended operation - in case of registers this is made explicit by using EAX, AX and AL/AH respectively to denote the DWORD (32bit), WORD (16bit) and BYTE (8bit) sizes. However, the line:
mov DWORD PTR [esp], OFFSET FLAT:.LC0
shows neatly how you have to be explicit about the size of memory locations to get it right. The AT&T movl mnemonic implies this because of its inherent meaning of "move long" (32bit here), so no need to mention that we are accessing a DWORD other than in the l in movl.
Please note: I trimmed some irrelevant parts at the top and the bottom of the generated assembly code for brevity.
MIPS resources
For the inclined reader I would recommend getting a copy of the excellent, albeit pricey:
- "Introduction to Assembly Language Programming", 2nd ed., by Sivarama P. Dandamudi, Springer 2004/2005 (ISBN 978-0-387-20636-3)
If you want to experiment with MIPS, you can get SPIM, refer to its documentation or simply use a search engine to find useful information such as this Quick Tutorial.
x86 resources
Again, use a search engine to find more information or consult the documentation of your favorite assembler, such as NASM.
Disassembly
The process of translating the binary machine language back to a mnemonic representation, usually 1:1, is called disassembling or disassembly. The result of the process is commonly referred to as disassembly as well.
The tool used for the process is called a disassembler.
Since this is mostly a 1:1 process just like the reverse (assembly to machine code) there is no need to go into much more detail. There is one big difference between hand-written or compiler-generated assembly versus disassembly of the resulting binary code, and we'll see that a bit better by comparing the output of a disassembler and a compiler.
So without much further ado let's go to a practical example that shows why diffing is hard.
Why it is a hard task to compare binary executable code?
Note: For the remainder of this answer we'll use the Intel syntax for the assembly code. We'll also have some redundant parts of GCCs output removed for brevity.
Sample program - first iteration
C version
In our first iteration we have the following C code (I named it ptest1.c):
#include <stdio.h>

int syntax_help(int argc)
{
        return 20 + argc;
}

int main(int argc, char **argv)
{
        if (argc < 3)
                return syntax_help(argc);
        else if (argc == 3)
                return 42;
        // else ...
        return 0;
}
Assembly language version (with GCC, Intel syntax)
... compiling this into assembly with gcc -O0 -masm=intel -S -o ptest1.asm ptest1.c gives us:
.globl syntax_help
        .type   syntax_help, @function
syntax_help:
        push    ebp
        mov     ebp, esp
        mov     eax, DWORD PTR [ebp+8]
        add     eax, 20
        pop     ebp
        ret
        .size   syntax_help, .-syntax_help
.globl main
        .type   main, @function
main:
        push    ebp
        mov     ebp, esp
        sub     esp, 4
        cmp     DWORD PTR [ebp+8], 2
        jg      .L4
        mov     eax, DWORD PTR [ebp+8]
        mov     DWORD PTR [esp], eax
        call    syntax_help
        jmp     .L5
.L4:
        cmp     DWORD PTR [ebp+8], 3
        jne     .L6
        mov     eax, 42
        jmp     .L5
.L6:
        mov     eax, 0
.L5:
        leave
        ret
Sample program - second iteration
Now let us modify the program a little and then assemble it again, just to see how it looks.
C version
#include <stdio.h>

int syntax_help(int argc)
{
        switch (argc)
        {
        case 0:
                return -1;
        case 1:
                return 23;
        default:
                return 20 + argc;
        }
}

int main(int argc, char **argv)
{
        if (argc < 5)
                return syntax_help(argc);
        else if (argc == 5)
                return 42;
        // else ...
        return 0;
}
As you can see the two instances of 3 in main changed to 5 and we tinkered a bit with the "logic" in syntax_help. Clearly this is a contrived example, but then that's the exact point.
Assembly language version (same options as above)
.globl syntax_help
        .type   syntax_help, @function
syntax_help:
        push    ebp
        mov     ebp, esp
        mov     eax, DWORD PTR [ebp+8]
        test    eax, eax
        je      .L3
        cmp     eax, 1
        je      .L4
        jmp     .L7
.L3:
        mov     eax, -1
        jmp     .L5
.L4:
        mov     eax, 23
        jmp     .L5
.L7:
        mov     eax, DWORD PTR [ebp+8]
        add     eax, 20
.L5:
        pop     ebp
        ret
        .size   syntax_help, .-syntax_help
.globl main
        .type   main, @function
main:
        push    ebp
        mov     ebp, esp
        sub     esp, 4
        cmp     DWORD PTR [ebp+8], 4
        jg      .L9
        mov     eax, DWORD PTR [ebp+8]
        mov     DWORD PTR [esp], eax
        call    syntax_help
        jmp     .L10
.L9:
        cmp     DWORD PTR [ebp+8], 5
        jne     .L11
        mov     eax, 42
        jmp     .L10
.L11:
        mov     eax, 0
.L10:
        leave
        ret
That's a mouthful. Now let's dig into one difference - aside from the "optimization" aspect - between this and a potential human-written piece of assembly that does the same. Here's what a human-written version might look like:
.globl syntax_help
    .type   syntax_help, @function
syntax_help:
    push    ebp
    mov ebp, esp
    mov eax, DWORD PTR [ebp+8]
    test    eax, eax
    je  .zero_args
    cmp eax, 1
    je  .one_arg
    jmp .return_20plus
.zero_args:
    mov eax, -1
    jmp .exit_help
.one_arg:
    mov eax, 23
    jmp .exit_help
.return_20plus:
    mov eax, DWORD PTR [ebp+8]
    add eax, 20
.exit_help:
    pop ebp
    ret
    .size   syntax_help, .-syntax_help
.globl main
    .type   main, @function
main:
    push    ebp
    mov ebp, esp
    sub esp, 4
    cmp DWORD PTR [ebp+8], 4
    jg  .return_42
    mov eax, DWORD PTR [ebp+8]
    mov DWORD PTR [esp], eax
    call    syntax_help
    jmp .exit
.return_42:
    cmp DWORD PTR [ebp+8], 5
    jne .return_0
    mov eax, 42
    jmp .exit
.return_0:
    mov eax, 0
.exit:
    leave
    ret
Anyone who has ever written assembly code will inevitably notice how I am not declaring variables (db, dw, dd) here. This would be the normal course of action, but of course here I was merely showing that we humans tend to give symbolic names to code locations (and variables). If you hand write assembly, it would look still different, I merely adjusted the code to look a bit more like what a human might write (i.e. it's not perfect and certainly not "hand-optimized"). The compiler will stubbornly and efficiently tack a number on some kind of lettered prefix and be done with it. Let's also create a possible human-written version of the first iteration, using the same names:
.globl syntax_help
    .type   syntax_help, @function
syntax_help:
    push    ebp
    mov ebp, esp
    mov eax, DWORD PTR [ebp+8]
    add eax, 20
    pop ebp
    ret
    .size   syntax_help, .-syntax_help
.globl main
    .type   main, @function
main:
    push    ebp
    mov ebp, esp
    sub esp, 4
    cmp DWORD PTR [ebp+8], 2
    jg  .return_42
    mov eax, DWORD PTR [ebp+8]
    mov DWORD PTR [esp], eax
    call    syntax_help
    jmp .exit
.return_42:
    cmp DWORD PTR [ebp+8], 3
    jne .return_0
    mov eax, 42
    jmp .exit
.return_0:
    mov eax, 0
.exit:
    leave
    ret
Comparing compiler-generated assembly code
Here's the output of diff ptest1.asm ptest2.asm (the compiler-generated form):
1c1
<       .file   "ptest1.c"
---
>       .file   "ptest2.c"
9a10,22
>       test    eax, eax
>       je      .L3
>       cmp     eax, 1
>       je      .L4
>       jmp     .L7
> .L3:
>       mov     eax, -1
>       jmp     .L5
> .L4:
>       mov     eax, 23
>       jmp     .L5
> .L7:
>       mov     eax, DWORD PTR [ebp+8]
10a24
> .L5:
20,21c34,35
<       cmp     DWORD PTR [ebp+8], 2
<       jg      .L4
---
>       cmp     DWORD PTR [ebp+8], 4
>       jg      .L9
25,28c39,42
<       jmp     .L5
< .L4:
<       cmp     DWORD PTR [ebp+8], 3
<       jne     .L6
---
>       jmp     .L10
> .L9:
>       cmp     DWORD PTR [ebp+8], 5
>       jne     .L11
30,31c44,45
<       jmp     .L5
< .L6:
---
>       jmp     .L10
> .L11:
33c47
< .L5:
---
> .L10:
Not exactly helpful to understanding the differences, is it?
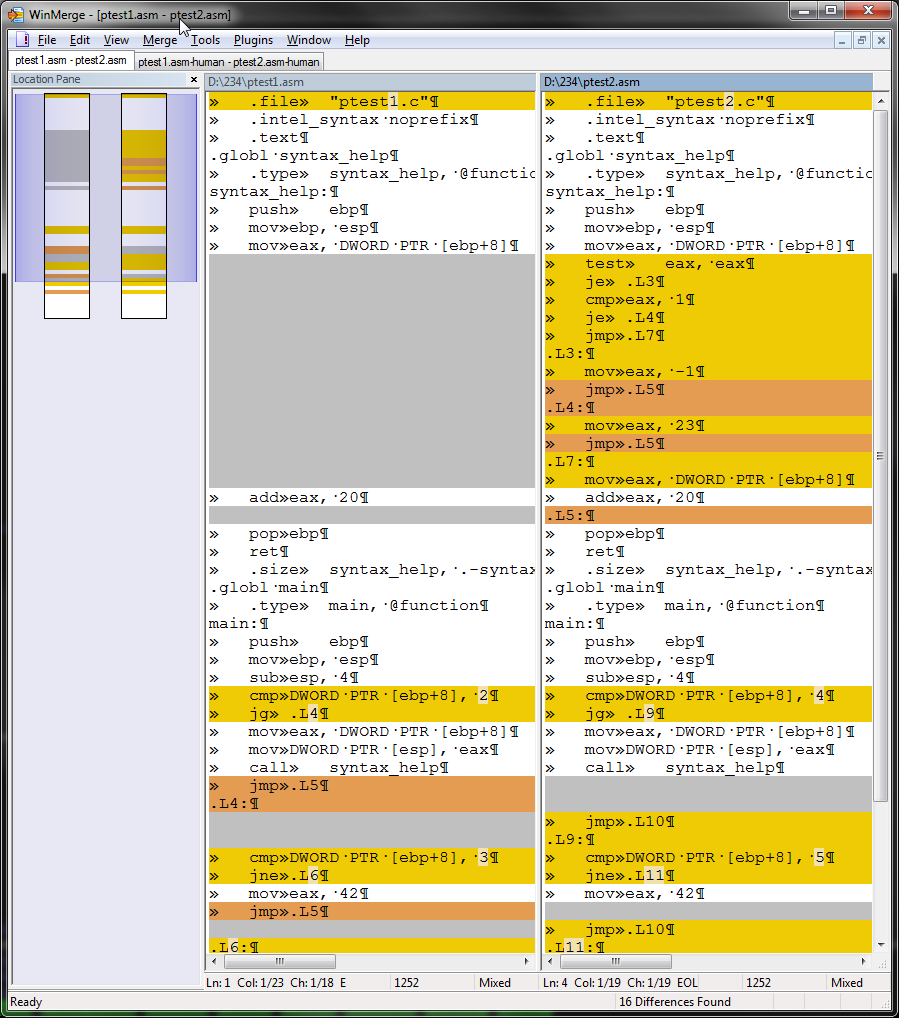
WinMerge provides a more visual result. Chaos ensues ...

NB: I decided to not doctor a full height screenshot, instead pay attention to the left pane which highlights the differences (yellow) and missing blocks (gray) and moved blocks (brown...ish).
Comparing "human-written" assembly code
Here's the output of diff ptest1.asm-human ptest2.asm-human ("human-written" form):
6a7,19
>       test    eax, eax
>       je      .zero_args
>       cmp     eax, 1
>       je      .one_arg
>       jmp     .return_20plus
> .zero_args:
>       mov     eax, -1
>       jmp     .exit_help
> .one_arg:
>       mov     eax, 23
>       jmp     .exit_help
> .return_20plus:
>       mov     eax, DWORD PTR [ebp+8]
7a21
> .exit_help:
17c31
<       cmp     DWORD PTR [ebp+8], 2
---
>       cmp     DWORD PTR [ebp+8], 4
24c38
<       cmp     DWORD PTR [ebp+8], 3
---
>       cmp     DWORD PTR [ebp+8], 5
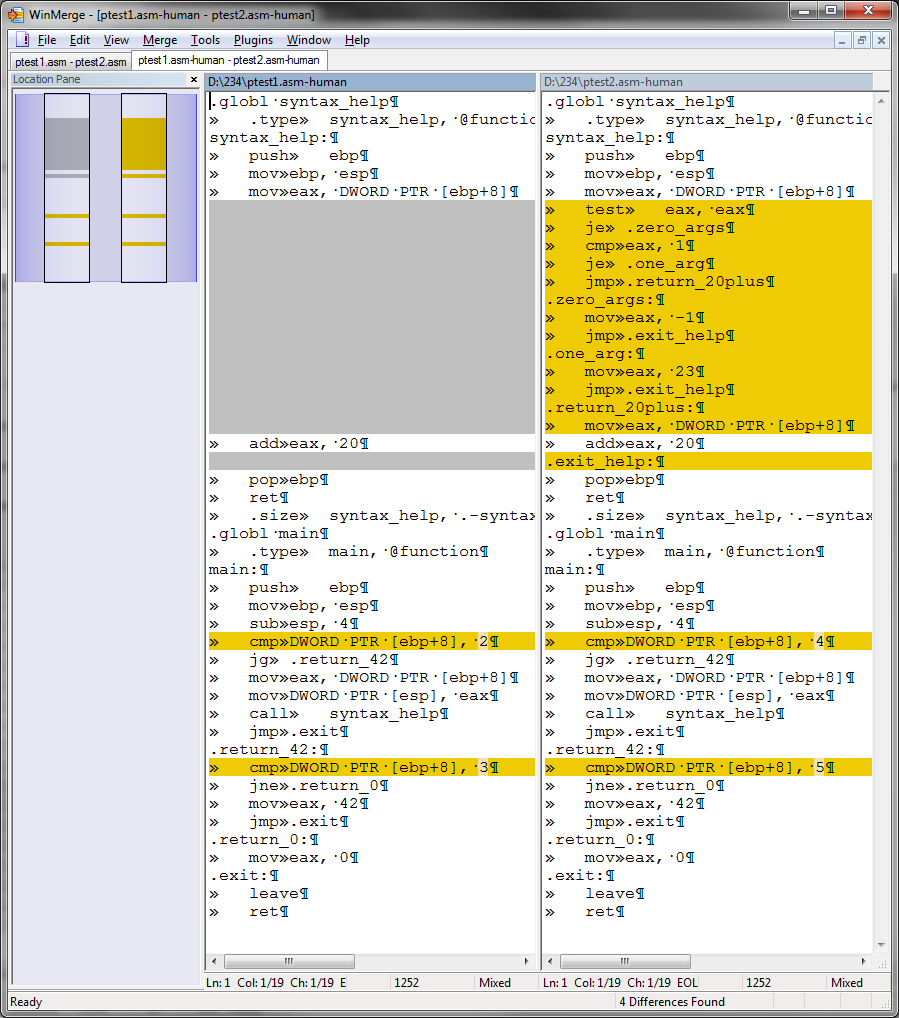
Whoa, that's actually almost readable. Use colordiff and it's useful.
The respective visual comparison in WinMerge looks downright readable:

Interlude - basic blocks
A disassembler can only be smart to a certain extent, because it's a program. Even IDA Pro, hands down the most advanced disassembler as of this writing, will not be able to guess everything right - e.g. when distinguishing code or data. But the more sophisticated tools do a pretty good job at it. And IDA adds the I as interactive.
One thing disassemblers encounter are what assembly programmers is known as labels and (sub)routines.
Labels, although they exist in C and are (rightly) frowned upon together with goto, also exist in higher level language, but tend to cover a somewhat different concept. Perhaps the closest to the assembly language concept were the labels in the good old days of BASIC. When you compile C into assembly code, however, every condition gets translated into a conditional or unconditional jump (jmp, je, jg, jne in the above compiler-generated code). The jump targets are referred to as labels. The jumps are the places where the code branches conditionally or unconditionally.
The closest corresponding concept to a routine would be a function in C or the procedure/function in Pascal or the sub in BASIC.
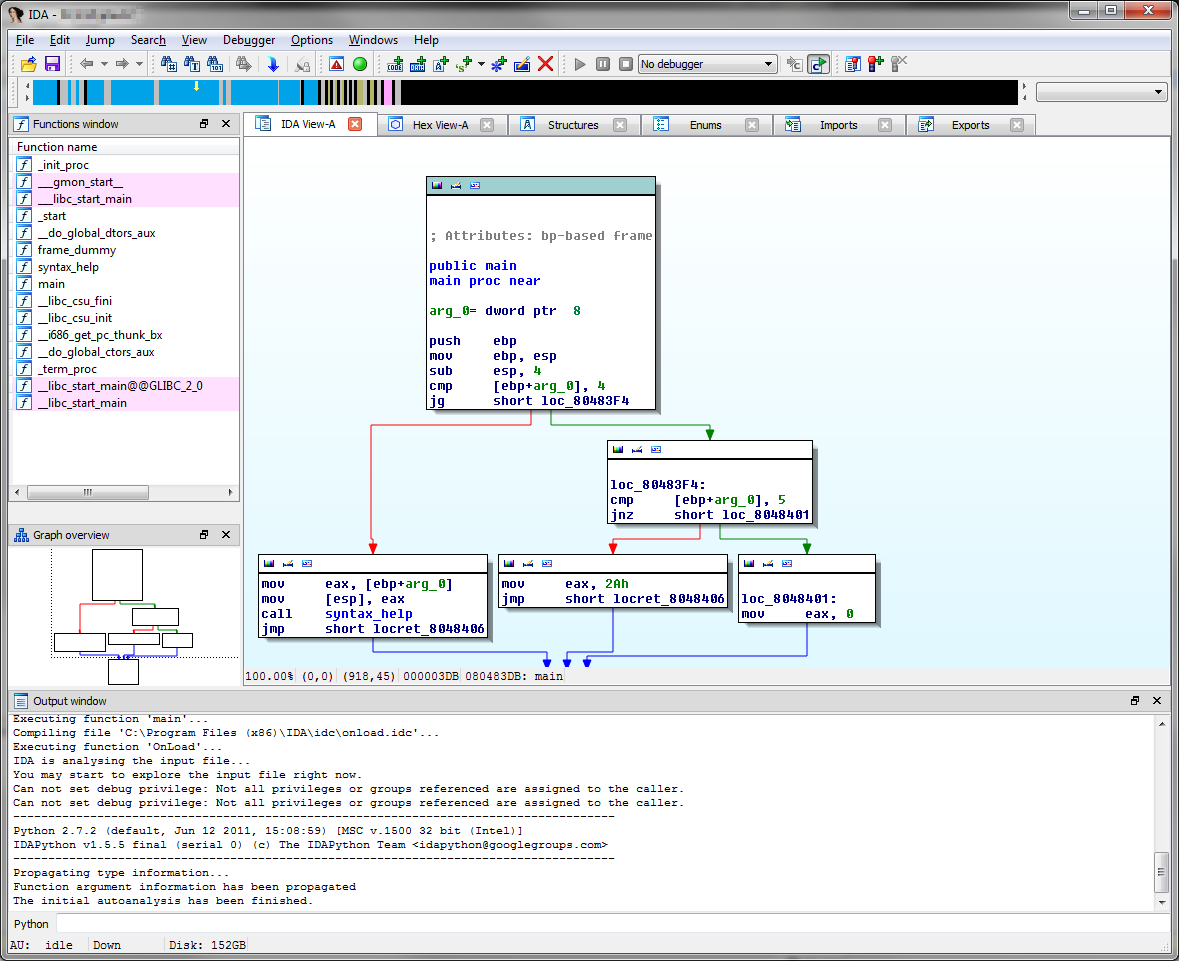
More or less each of the chunks of code between two branching instructions, other than call, are called basic blocks. In IDA Pro this is neatly visualized in the graph view (can be toggled with flat view via default Space):

Each of the blocks linked by the arrows in the main IDA-view would be a basic block.
Again, why it is a hard task to compare binary executable code?
By now you should have a faint idea what makes the comparison hard, but let's go the extra mile. Let's switch from comparing the compiler-generated and "human-written" assembly code to actual disassembly.
As before we will stick to the gist of it.
Compiler-generated versus disassembly
But just to mention it, in the disassembly you have the result after the linker mangled it. The compiler-generated assembly from before contained merely the code we had written in the sample program.
Just to give you an idea, I generated an .asm file using IDA, stripped it down to everything without comments and empty lines and still ended up with 362 lines, as opposed to 52 lines in the original compiler-generated assembly which included meta-data used by the linker. This whopping difference can of course be attributed to the linker adding all kinds of code required to initialize the executable. In fewer words: it's boiler plate code the compiler (or more precisely its linker) adds.
For this comparison I am going to leave out this boiler plate code entirely, although obviously this only adds to the complexity a diff tool will encounter when comparing binary executable code.
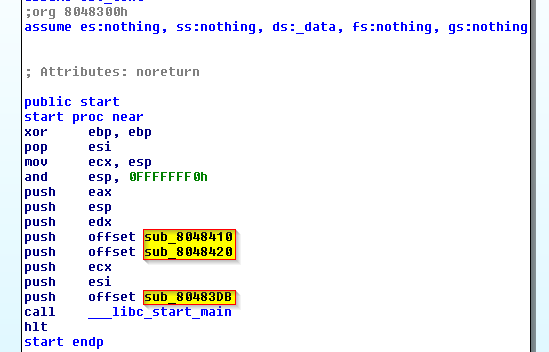
Unlike in the IDA screenshot above, which shows ptest2.c disassembled, in reality you will mostly have to work without debug symbols. This means the names such as main and syntax_help will no longer exist. Instead disassemblers such as IDA Pro mostly resort to naming the routines after their offset (e.g. sub_80483DB). It applies the same for labels (i.e. naming those loc_80483F4 or locret_something). Of course the reverse engineer is free to change these names to something more readable/recognizable for herself. But the default names still depend on the offset.
In fact the disassembler will have a hard time to identify the main function, because the aforementioned boiler plate code tends to come before it when looking at it starting from the entry point of the executable. Here's what IDA shows you if there are no symbols available to the compiled ptest2.c from before (i.e. ran strip -s ...):

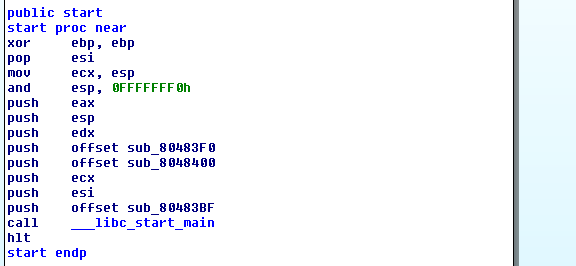
Now let's look at the entry point for the compiled (and stripped) ptest1.c as well:

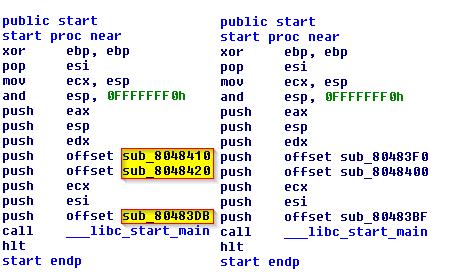
Do you notice the difference? It's subtle, but let me put them side to side for you:

Yes, the highlighted lines ... ooh the offsets differ. What does that mean?
Well, it means that the symbolic names IDA Pro assigns to routines and also to labels (i.e. basic blocks) will differ based on the offset of these entities within the file.
This is very similar indeed to what we encountered before with the compiler-generated assembly code and the numbered label names.
Using a simpler disassembler
Let's compare the relevant pieces of code created by a simpler disassembler in a text differ.
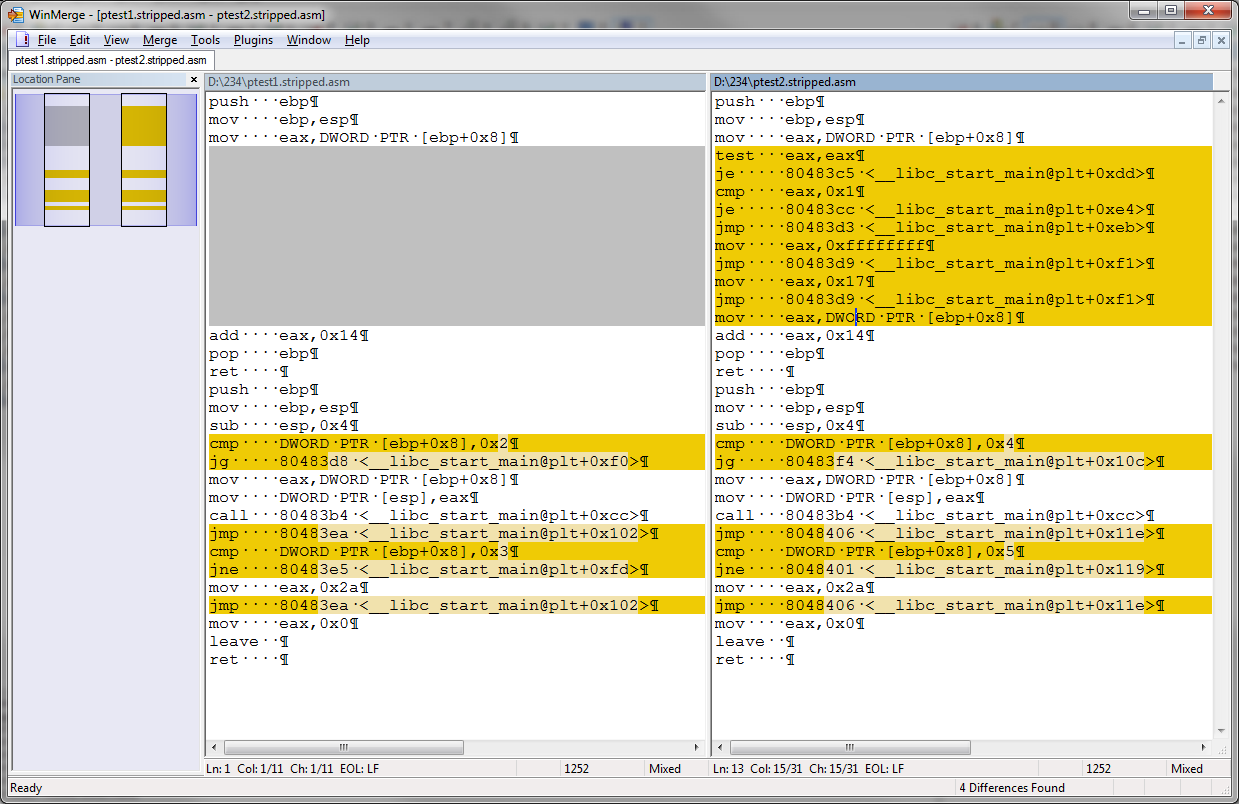
Using objdump -M intel -d ... and then getting rid of the leading offsets and spaces we get this for the relevant parts in WinMerge:

Full commands were:
objdump -M intel -d ptest1.stripped|grep '^ 80'|cut -f 2- -d ':'|sed 's/^\s*//g'
objdump -M intel -d ptest2.stripped|grep '^ 80'|cut -f 2- -d ':'|sed 's/^\s*//g'
Conclusion
This means text diffing tools such as diff, kdiff3, WinMerge and many others will have a hard time comparing disassemblies unless the reverse engineer took the time to rename all routines and labels to something not based on the offset.
In fact this becomes an almost insurmountable task when facing a disassembly in textual form. The internal form IDA Pro keeps of the disassembly is much more suitable.
In text form every single changed offset - and there will be loads of those - will draw your attention because it is a difference to a text differ.
Solutions
Not that we know the problem, what can we do about it?
Basic blocks are the answer to the problem at hand. Tools like DarunGrim (FLOSS), patchdiff2 (FLOSS) and Bindiff (commercial) use IDA's knowledge about basic blocks to build graphs. These graphs can then be used to identify similar and different blocks. With the abstraction in the form of a graph the visualization can be superimposed on the respective view inside IDA or a specialized view can be offered.
As you see, when you export your disassembly to a text file, you are stripping a whole lot of contextual information from it which IDA keeps for you in its database. Instead draw from the information IDA already has and use it. Plugins and scripts allow you to reach into the guts of the IDA database and extract what treasures are in there to make sense of basic blocks in a way a text differ will never be able to.
Tools
For a listing of tools able to tackle the task, refer to the answers to the question which sparked this one:
Further reading
TL;DR
The reason text differs are insufficient for handling textual disassembly is because the textual representation discards valuable information the disassembler collects during the process of disassembling. Also disassemblers name the code locations and variables after their offsets - changes to a program with subsequent recompilation will change virtually all offsets and therefore create a lot of noise in the textual representation. Text differs will point out every single one, making it impossible to find the relevant changes from the reverse engineer's point of view.
